Optimizing INP for a React App & Performance Learnings
 Photo by Evie S.
It's been 2 years that I've been working at Vio and since the beginning, I've been working on web performance-related projects. The most notable projects are these:
- Profiling & Optimizing the runtime performance with the DevTools Performance tab
- Web performance, code splitting strategies, and a React case study
- Webpack Bundle Splitting & Browser Caching
- The Evolution of React Rendering Architectures & Web Performance
Some work on runtime performance, some on bundle optimizations, and also on the architectural level of our application.
This post I want to focus on the past 6 months I've been focusing my work on optimizing the INP metric, or Interaction to Next Paint.
We'll see an overview of the INP metric, how I debug performance bottlenecks using the devtools and the React profiler, some explorations I did and what I found, solutions and optimizations, and finally a list of performance learnings I got while doing all this work.
INP: An overview
INP stands for Interaction to Next Paint and it assesses a page's overall responsiveness to user interactions by observing the latency of all qualifying interactions that occur throughout the lifespan of a user's visit to a page.
A type of user interaction can be:
pointerup: Tapping on a device with a touchscreen.keyup: Pressing a key on either a physical or onscreen keyboard.click: Clicking with a mouse.
These are all the steps that occur in an interaction:
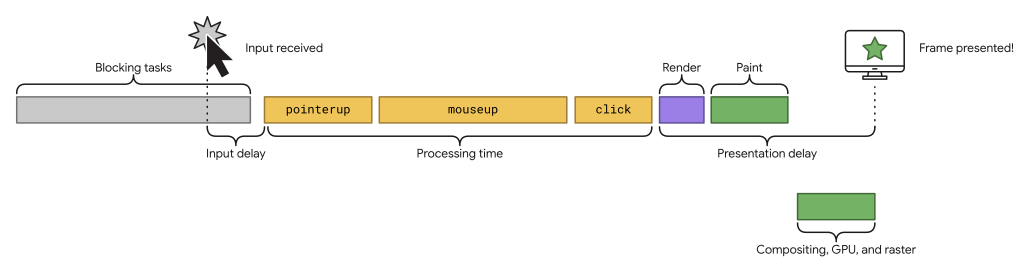
- Input delay: the time between the interaction and the event handlers start running
- Processing time: the time it takes to run the event handlers
- Presentation delay: time to render, paint, and present the frame
We'll see why this breakdown is important in a minute. But for now, you just need to know that the interaction is divided into 3 phases and there are different ways to optimize each one of them.
Data & Monitoring: measuring INP
In this section we'll see more about data, how to measure and monitor, and the INP scores.
First of all, here's how to think about the score:
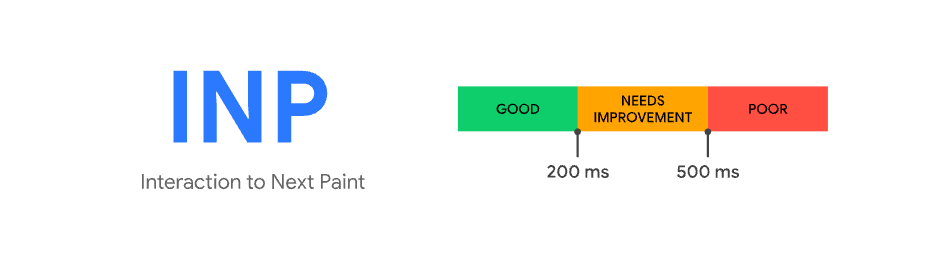
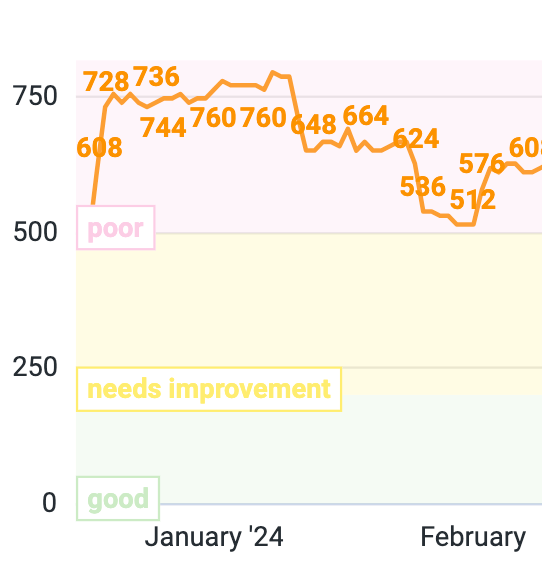
INP measures all the interactions from a user session and the worst one will be evaluated in this threshold:
- Good: until 200ms
- Needs improvement: until 500ms
- Poor: worse than 500ms
Getting this idea and applying it to my context: I'm currently working on the vio.com search results page (SRP). As you may expect, a search results page provides many elements in the page to interact with like filters, card items, search input, map, sorting function, etc. Because of that, it comes with great complexities, so it's not that easy to optimize it. There are a lot of moving parts, and as the software grew, it became more and more complex with more features on top of others.
My first goal was to measure the INP metric and check where was the performance bottleneck. Later on, I'll show how I debug performance issues, but first, let me talk a bit about measuring and storing data.
I've worked on measuring the INP metric using the web-vitals library and storing it in two ‘buckets': one in Datadog, so we could check them in real-time and the other in Looker to store it for historical reasons.
There are two other important parts of this measurement I wanted to share.
The first one is still about INP: web-vitals released a beta version that we can start measuring each step of the INP score. So now we know how much time it takes for input delay, processing time, and presentation delay separately. This brings a lot of insights.
Talking to some performance experts, I asked about the threshold for each breakdown phase. Here's how to think about them.
- Use these numbers to give you a hint for where to optimize, rather than try to reach an
msgoal with each of them in isolation. e.g. With such a long processing time and with a not-so-short input delay, I'd guess that the main thread is extremely busy, I'm guessing it's running a lot of JS. - The breakdown percentages are pretty different depending on how the site is performing. e.g. if the site has good INP and is running very little script then you'd probably expect presentation delay to be the highest (by percentage), but if it's a highly interactive site then you'd expect to see higher percentages in input delay and processing duration.
- General advice:
- Input delay < 50
- Processing time < 100
- Presentation delay < 50
There is common advice on how to approach each phase of this breakdown:
Input delay: Common optimizations: reduce expensive main thread work
- Reduce or avoid recurring timers that kick off excessive main thread work
- Reduce or avoid long tasks
- Reduce or avoid interaction overlap
Processing time: Common optimizations: reduce expensive callback events
- Do as little work as possible: remove, skip, memo
- Defer non-rendering work in the event callback to a later point in time: yielding, transitions
- Move (non-UI) tasks to a Service Worker (SW)
Presentation delay: Common optimizations: reduce the rendering process
- Large DOM sizes: recalculating a large number of nodes can be costly
- Forced reflows: avoid large, complex layouts and layout thrashing. It happens when you apply style changes to elements in JavaScript, and then query the results of that work.
- Excessive or unnecessary work in ****
requestAnimationFramecallbacks. ResizeObservercallbacks.
The second part is about having our own metric for one of the most important parts of the search results page: when the user clicks the hotel card and opens an overlay with all the hotel details in it. This brought a lot of value for us because INP is a very broad metric and we wanted to see if optimizing this specific part of the search page would lead to improvements in this specific metric. Turns out that “product-minded” metrics are really helpful and we could also see the effect on the INP metric whenever we're optimizing the website.
Specifically for our website's search page, INP was pretty bad 6 months ago. We improved it a lot (but still not good enough if you want my honest opinion — we're working on it).
I usually break down the metric into different groups to have a better overview of what's going on. I have a general INP score, one for each device group (desktop, mobile, tablet), one for Android, and one for iOS. These are the basic ones. (I have others like grouped by country/internet connection, etc).
The mobile score was poor. Even the desktop was poor. Now we reached a better score, but we'll talk about the results later on after showing some solutions, fixes, and improvements we did. In general, INP was bad and we had a lot of work to do.
After collecting data, we knew our performance status and could start working on the exploration, debugging, and optimizations.
Devtools: exploring and debugging perf issues
Optional setup I use:
- Install the web-vitals extension
- Run the app on CPU: 4x slowdown and Network: fast 3g
Measuring:
- Open the performance tab on devtools
- Record → Do the interaction you want to measure → stop recording
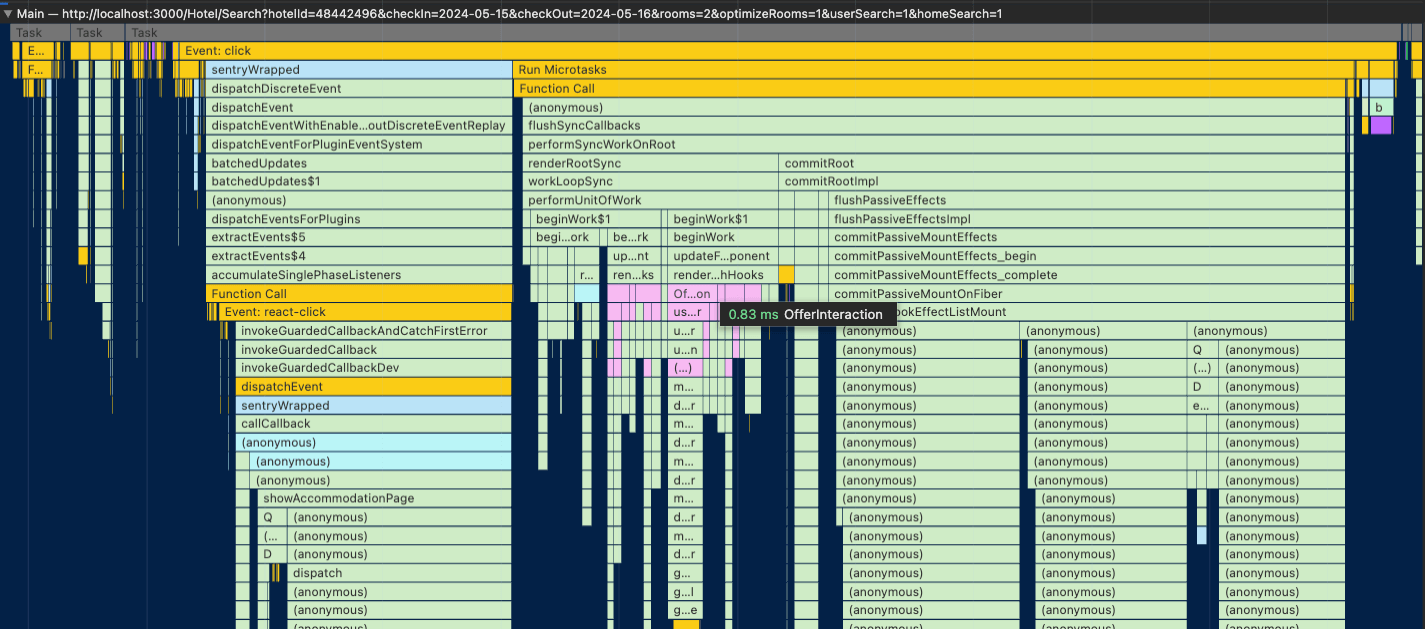
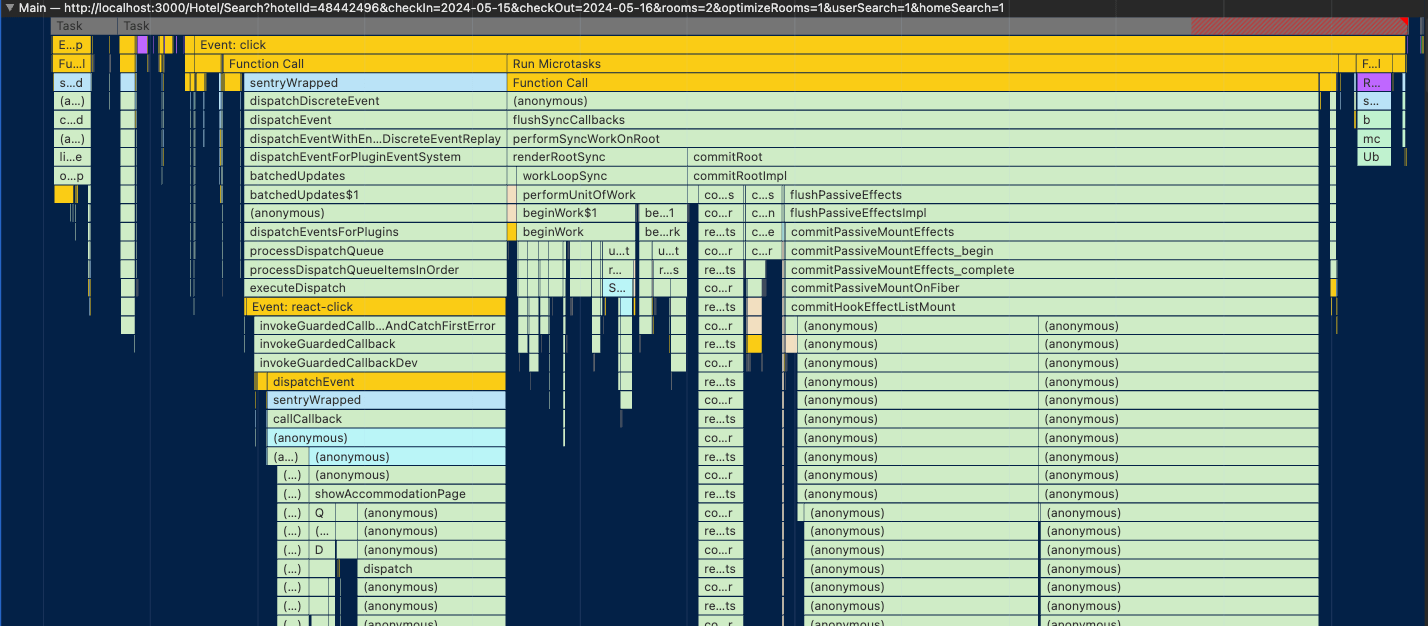
- The flamechart will appear:
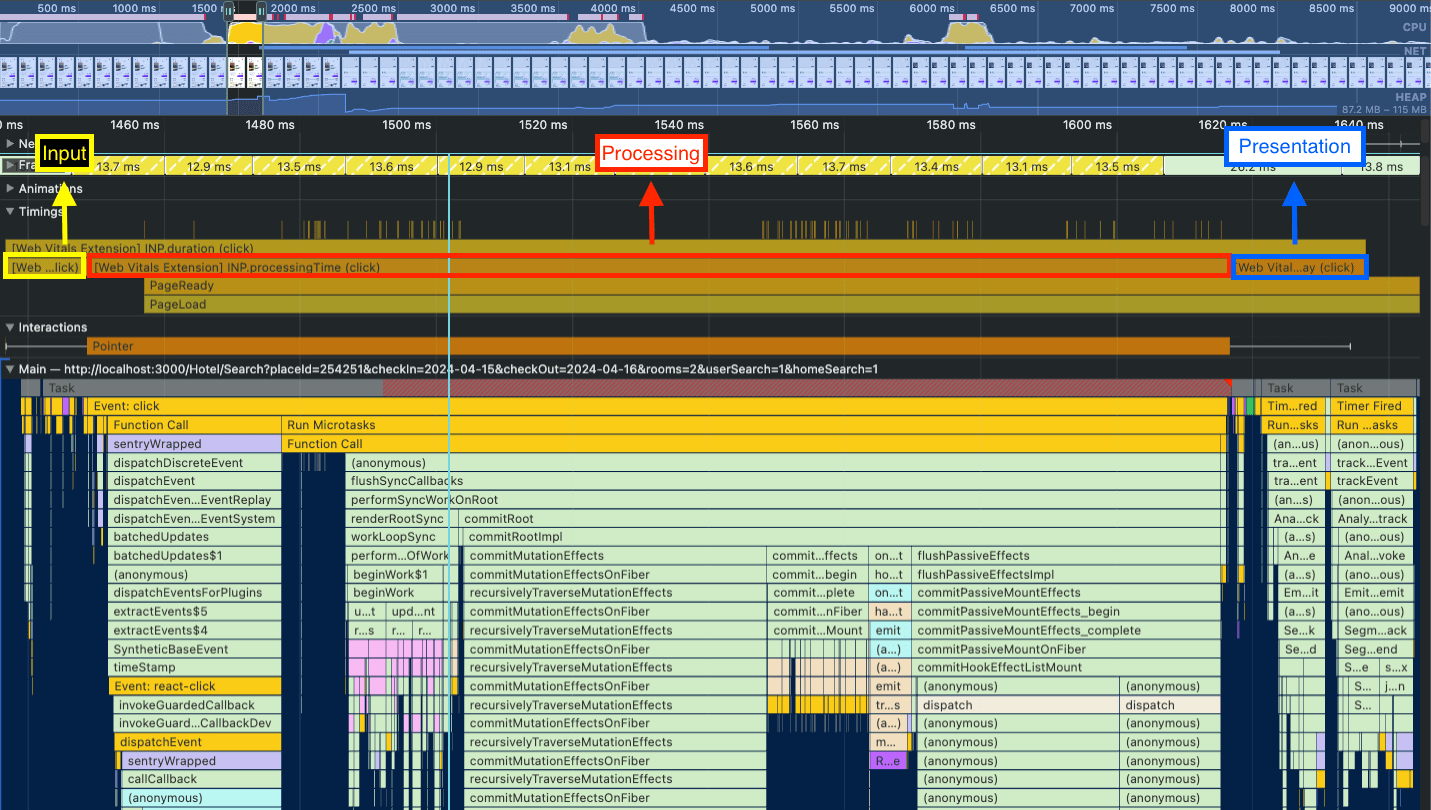
The web-vitals extension is an interesting setup because it will add the labels to the Timings. There you can see when the INP metric starts and finishes. It will also provide the INP breakdown for you so you can check when each phase starts and finishes too.
In the flamechart above you can see that the input delay is quite small, and the presentation delay takes a bit more time, but the biggest issue is related to the processing time.
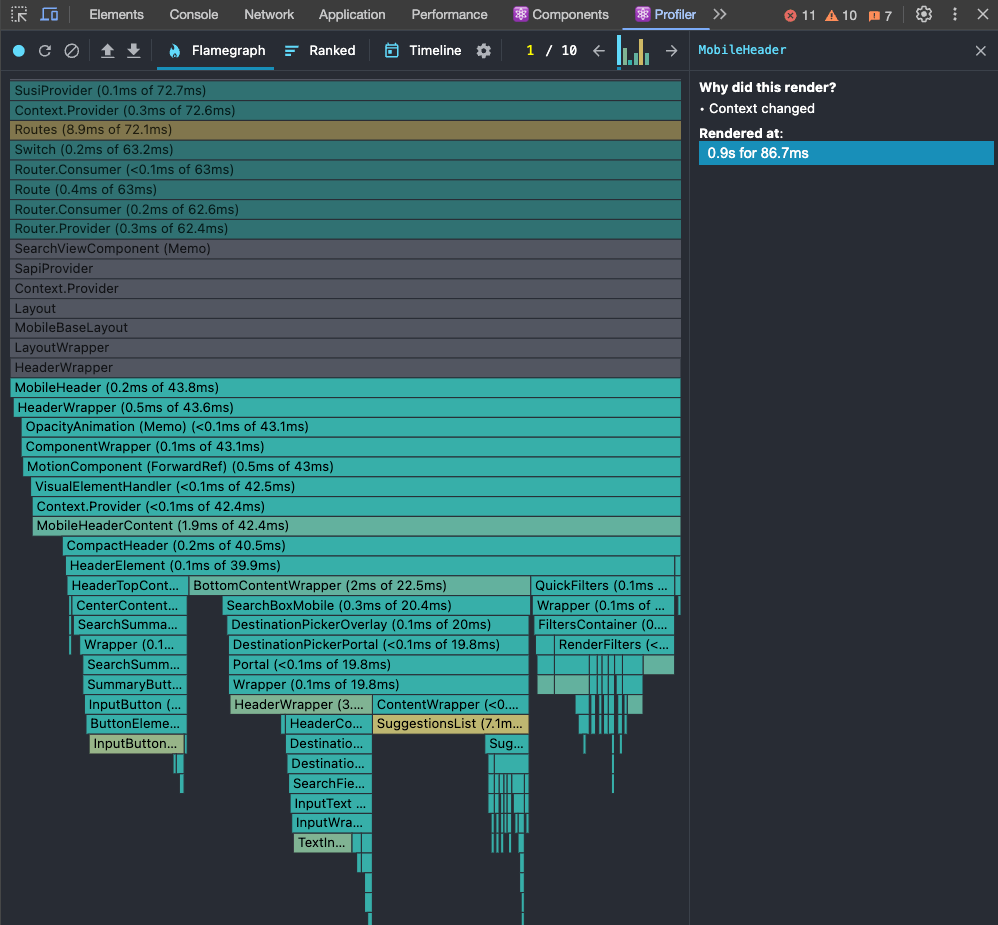
React Devtools: exploring and debugging perf issues
Going deeper into the processing time phase, for React apps, it's very common that we are unnecessarily re-rendering components. The culprits can be custom hooks, contexts, or other parent components re-rendering.
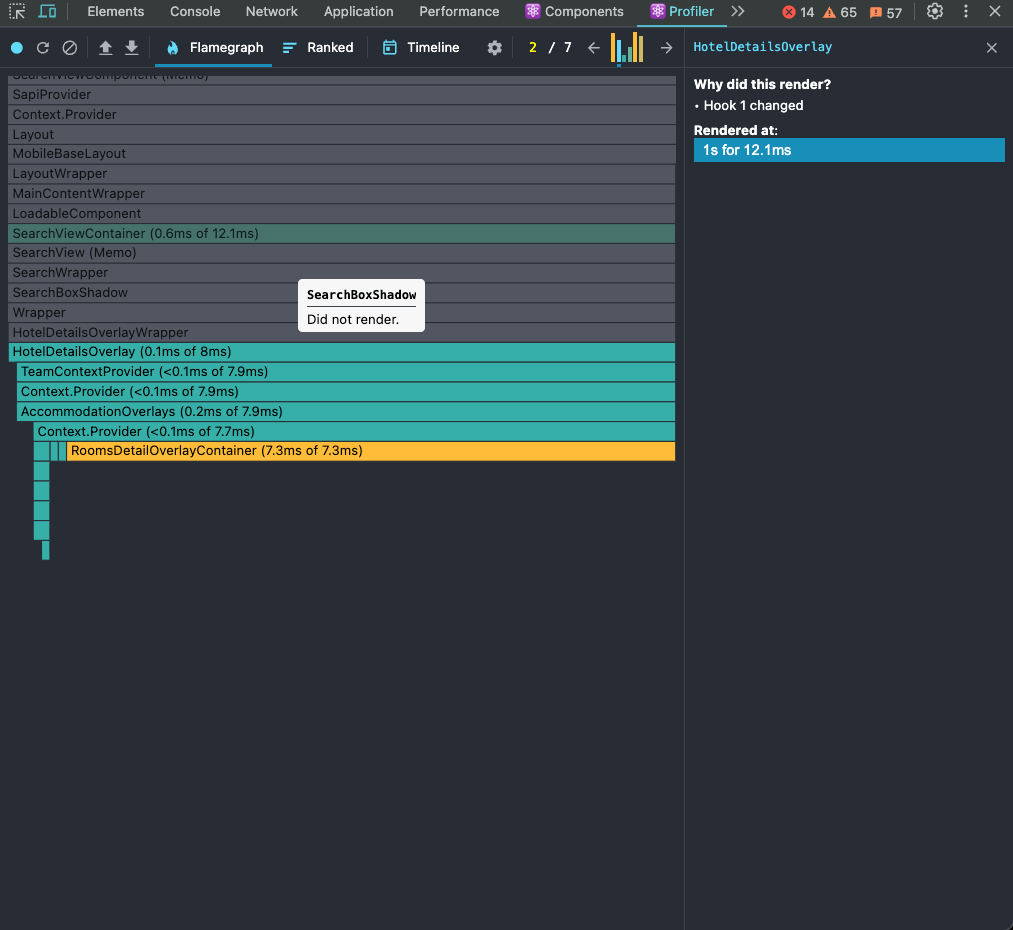
Using the react-dev-tools profiler, we can record the interaction we want to explore and check what's being re-rendered. There are usually 3 culprits:
- Parent rendered: focus on the parent optimization. reduce re-rendering for that component, check which state change that's causing the parent component to be re-rendered
- Props changed: the easiest one to spot as the profiler shows which props are changing.
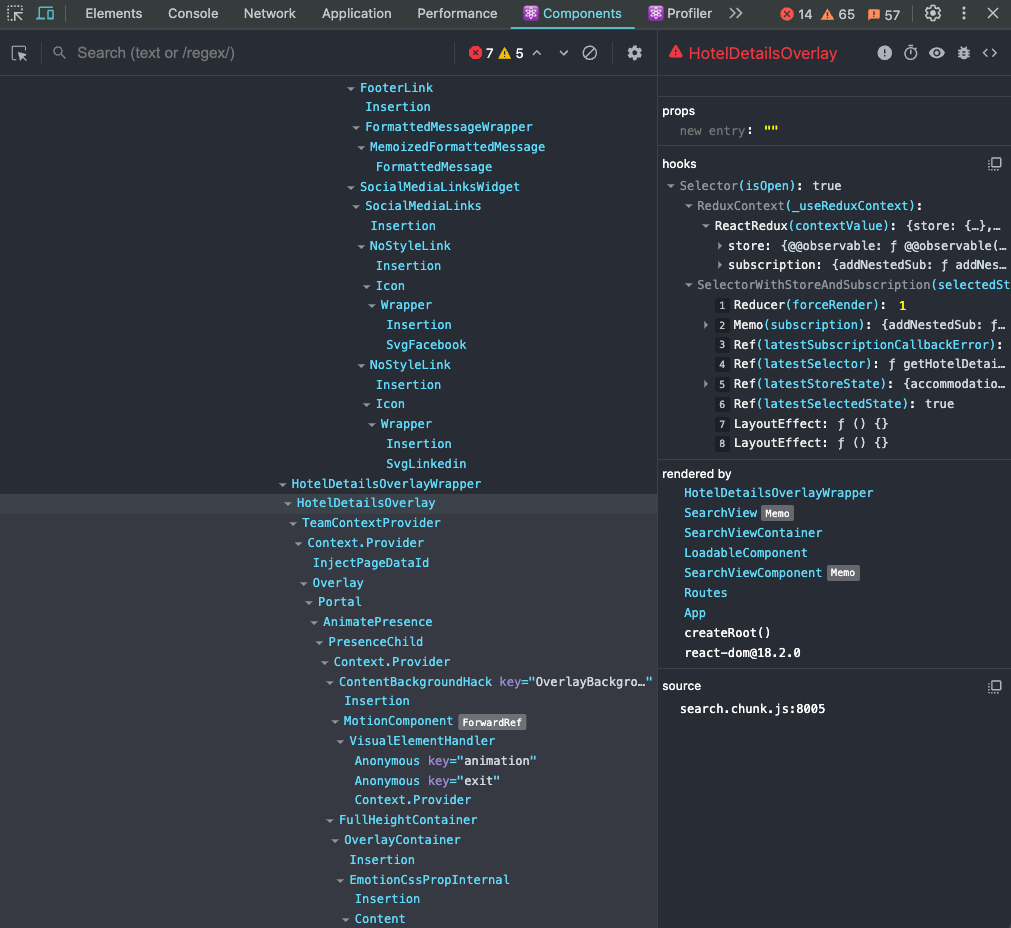
- Hook changed: you need to go to the react components tab to check which hook is causing the re-rendering. In the table below, the Hook caused the re-rendering, so we need to go to the component and check which hook is that.
Profiler: In the profiler, you’ll see all the components that are being rendered or re-rendered and why they are rendering (again). In this case, this is caused by a hook change (hook #1). So you need to go to the components pane and check the hooks there.
Components: Now in the components pane, there’s a “hooks” section and they are numbered. Because in the profiler it says that hook #1 triggered the re-rendering, this is the number we need to find in the hooks section. You can see that hook #1 is the isOpen state, probably a selector getting this state.
There’s another trick to get the state that’s changing and causing the re-render.
Use a useEffect for that state like that
useEffect(() => {
  console.log('re-rendering culprit:', state);
}, [state]);
When performing the interaction, if the component logs the state, it means the state is changing and causing the re-rendering. Now we need to find what’s causing the change and stop it.
Another helpful piece of advice is to check all states that are changing when performing the interaction. When updating those states, you can see where they are used and check if they are the culprits of the components’ re-rendering.
Performance Exploration: debugging, spotting issues & optimizations
The project I'm working on is focused on improving the performance of our search results page (SRP). It means improving any interaction in the page (runtime performance) or the page loading.
A couple of months ago I was heavily improving page load through code splitting, bundle caching, and other performance techniques.
Because the SRP is very interactive, we have room for improvement in all of the interactions. It can be opening and rendering the “accommodation page” (AP — also known as the hotel details overlay), opening and interacting with filters, sorting, search box features, and many other features in the search result page.
It means that even if we improve one of the features, the INP score could improve only a bit, or not improve at all.
Here's what it looks like:
React 18
The biggest project I worked on was the React 18 migration. There are many benefits to migrating to React 18 including enabling Streaming SSR on Next.js (one of the big projects we have ahead) and client/server components, but I actively participated in this migration because of the new React rendering called Concurrent Rendering, and we are going to briefly talk about it later on.
The project was fast. We divided it into two phases:
- Backward compatibility
- Enabling the new rendering
For backward compatibility, we just needed to make some adjustments. Most of the work was bumping the version and making sure the application ran flawlessly.
- "react": "^17.0.2"
+ "react": "^18.2.0"

- "react-dom": "^17.0.2"
+ "react-dom": "^18.2.0"
That was most of the change that we needed to do for the first phase.
The second phase was to change to the new rendering. Changing from this:
import ReactDOM from 'react-dom';

const root = document.querySelector('#root');

if (root) {
  ReactDOM.render(<App />, root);
}
To this:
import { createRoot } from 'react-dom/client';

const rootElement = document.querySelector('#root');

if (rootElement) {
  const root = createRoot(rootElement);
  root.render(<App />);
}
We also needed to adjust some other things like whenever we are unmounting with the unmountComponentAtNode API, we should replace it with the new root.unmount(), the root being the element we should unmount.
That was it, concurrent rendering was deployed to and enabled in production!
I was very excited about this new feature and I was looking forward to seeing if we would get some improvements, especially in interactivity metrics like INP.
The reason for this excitement was the fact that, in React 17, it renders the page synchronously and React 18 uses concurrent rendering.
Using synchronous rendering, the rendering of the page needs to finish for the browser to respond to any user interaction. It’s an All-or-Nothing operation. There’s no space for higher-priority tasks.
Concurrent rendering means that for every 5ms (at least for React 18), React yields back to the main thread for it to check if it has a more important, higher-priority task to handle instead. One example of a high-priority task is any kind of user input like when a user clicks an element of the page or types a text in an input element in a form.
That way, the framework optimizes for better interactivity and user experience.
This was the results we got:
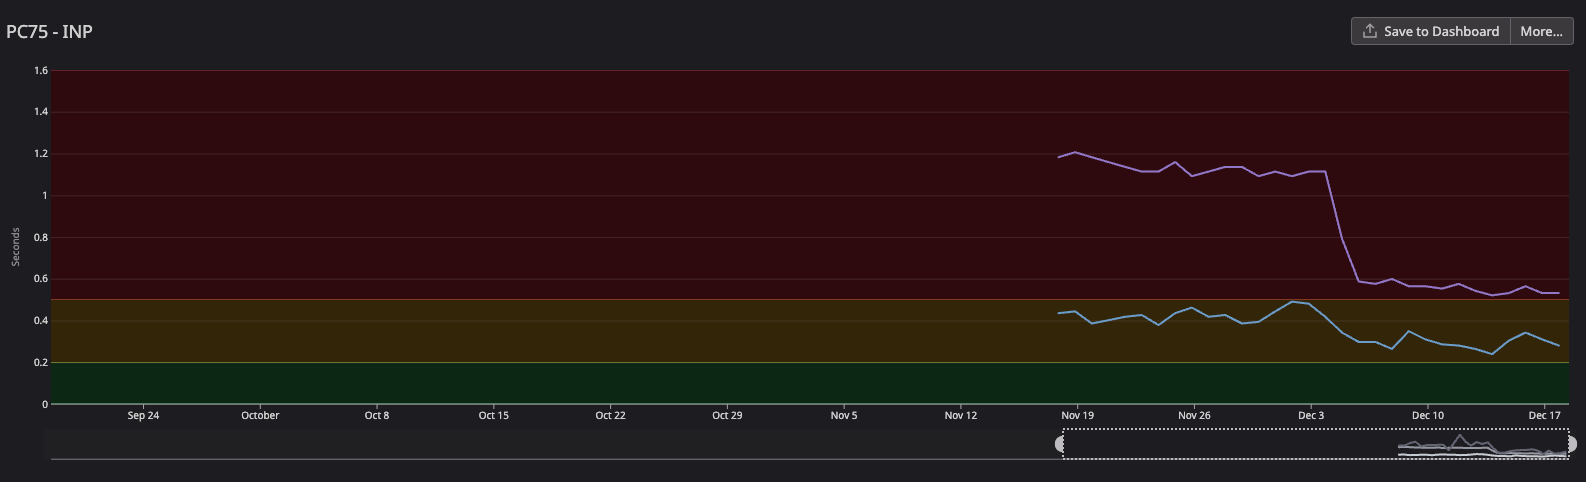
- The blue line is the desktop INP scores: we went from ~450ms to ~240ms (46% improvement). Way better but it still needs improvement
- The purple line is the mobile INP scores: we went from ~1.1s to ~500ms (54% improvement). That was way better but still poor
That was huge for us, especially looking at the mobile INP scores, it was very bad, and even though it was still bad after the migration, it looked much better. This helped improve all user interaction on the page.
Track Events
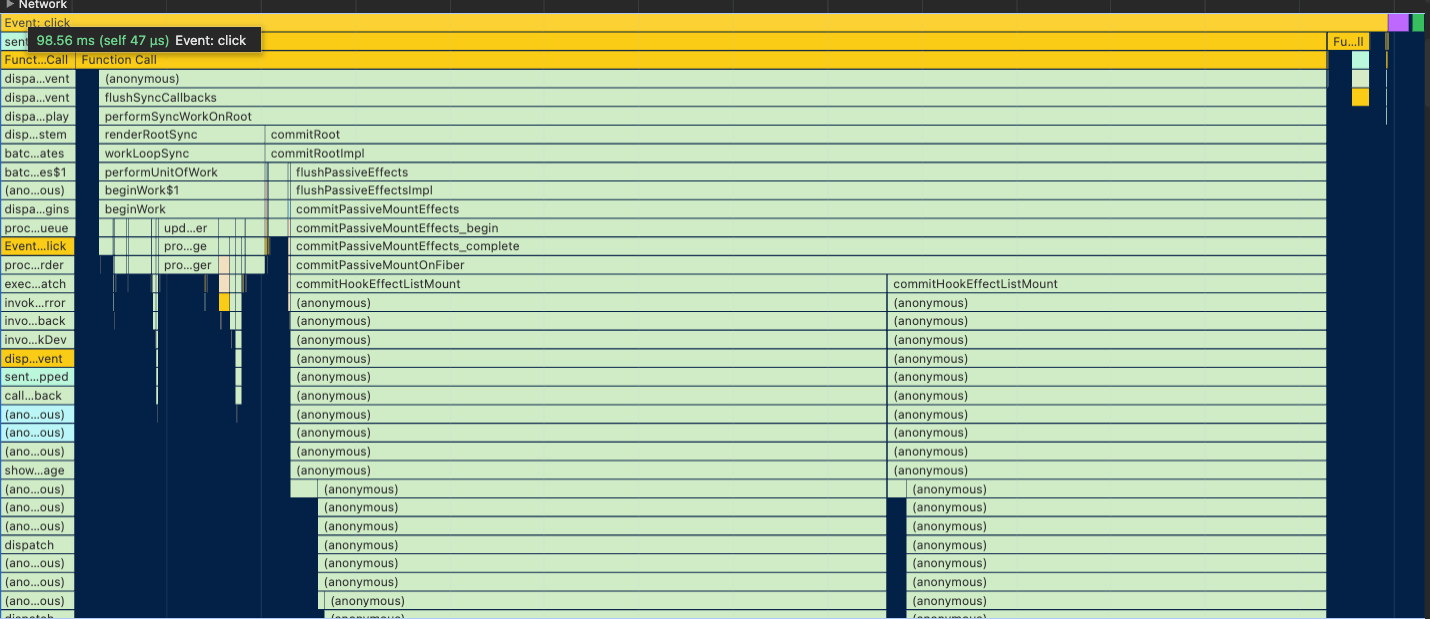
After working on the React 18 migration project, I started to debug the runtime performance to find the main bottlenecks in the search page. When running the performance record from devtools, I found that one of the biggest bottlenecks was track events (analytics, logs, etc).
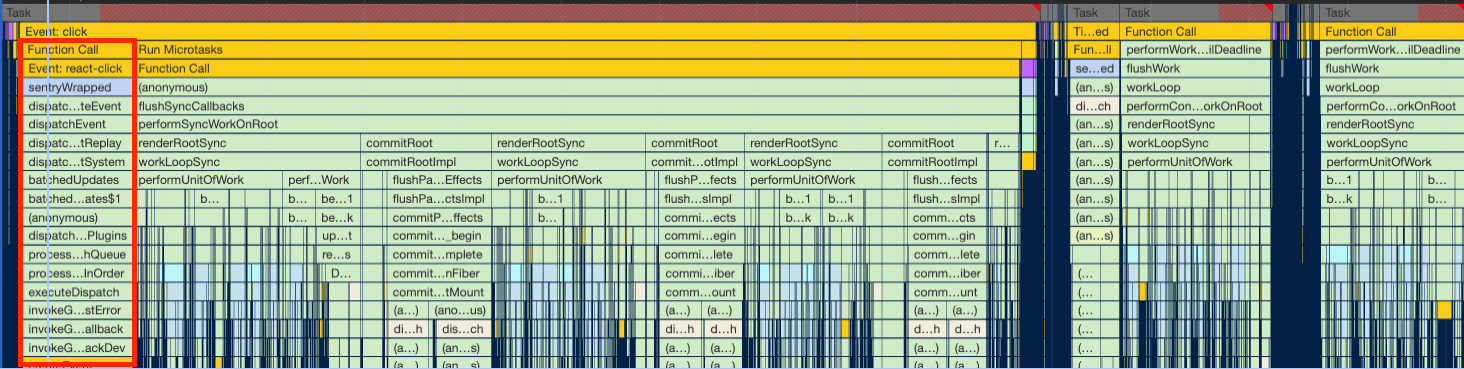
When looking at the flamechart, the first thing you notice at the click event is a big task block and I found 3 culprits there:
trackAnalyticsEvent: we dispatch this action to send analytics data to segmentlogEvent: we dispatch this action to send log data to datadogtrackFullStoryEvent: sending data to fullstory
They are all HTTP requests done in the Redux middleware, forming a long task.
My first idea was to move all track events off the main thread, using something like service workers, so we wouldn't have any of these bottlenecks when running the user interaction’s code. Configuring and enabling service workers in an application could take a while, so I thought we could have a simpler experiment, like a POC, to validate if prioritizing user-related operations over track events could lead to better INP scores.
Casey Carroll shared REI's INP improved by more than 50% when breaking the long tasks and postponing track events.
This is what he wrote me:
We experimented with this on 100% of traffic starting November 1st. We observed a 50% improvement to mobile visitor INP in CrUX.Some background, analytics DID NOT use beacons until 12/13. Analytics teams noticed some between navigation calls getting dropped through manual testing in December. We rolled back my change that yields to the main thread and still observed dropped metrics between navigations. We turned on beacons to resolve this on 12/13. We haven’t put my change back into production yet, as I’m trying to make sure it will not impact the integrity of metrics collection between page navigations.
That was the first validation I had that this experiment could go in the right direction. So, instead of working on a long service workers project, I focused on breaking the long task using the “yield to the main thread” technique.
The whole idea of yielding to the main thread is to break long tasks into smaller ones that won’t block the main thread. One strategy is to break it into two pieces
- Tasks that are required to apply visual updates for the next frame
- Everything else
You give control back to the browser to focus on the UI (and responses from UI interactions), that way, the UI-related tasks are prioritized and everything else is moved to subsequent tasks and doesn’t disrupt the work done for the UI.
So now the question is how do we do that? And we have a simple answer and a simple code: setTimeout:
async function yieldToMain() {
  return new Promise((resolve) => {
    setTimeout(resolve, 0);
  });
}
There's the code that could yield to the main thread before calling track events, in other words, postponing these operations to run later.
We could even improve this implementation with better ergonomics if the browser the user is using has the implementation of a Scheduler API.
async function yieldToMain() {
  if ('scheduler' in window && 'yield' in window.scheduler) {
    return await window.scheduler.yield();
  }
  return new Promise((resolve) => {
    setTimeout(resolve, 0);
  });
}
And this is how we use it:
case trackEvent.type: {
  await yieldToMain();
  trackAnalyticsEvent();

  await yieldToMain();
  logEvent();

  await yieldToMain();
  trackFullStoryEvent();
}
In the Redux middleware, before each track event, we yield to the main thread breaking the long task into smaller ones:
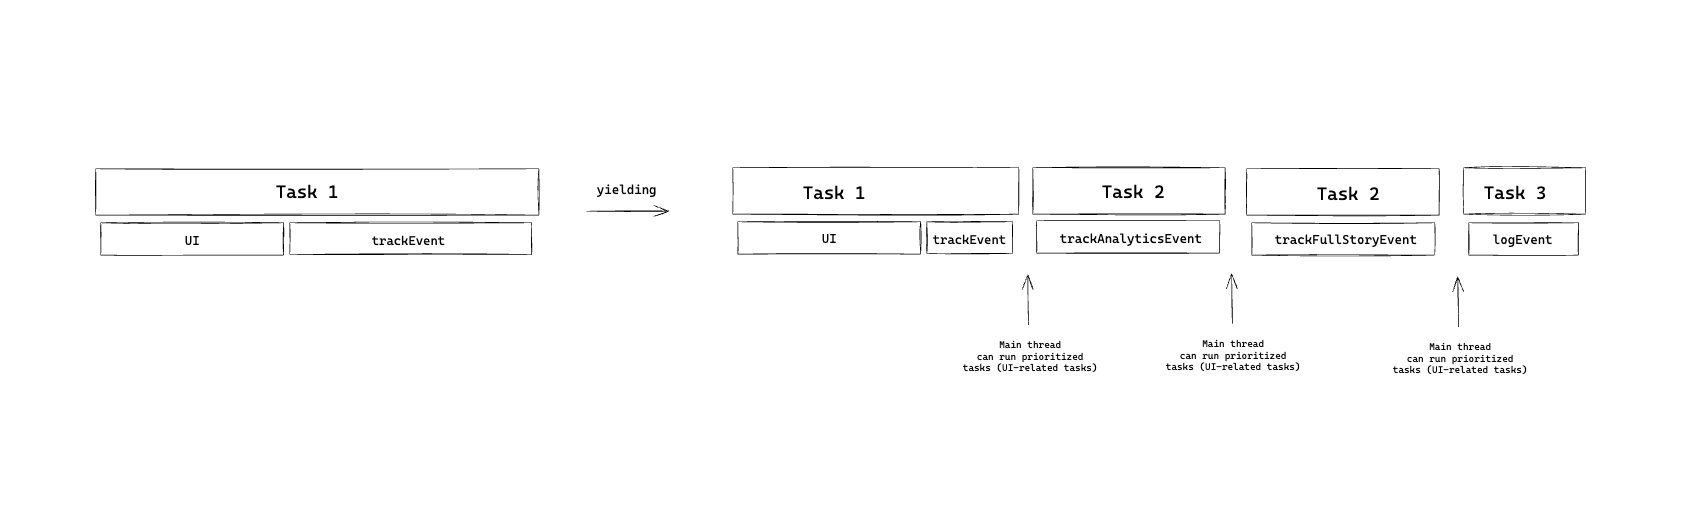
- Yield to the main thread (break the task into a new smaller separate task)
- Track analytics event
- Yield to the main thread
- Log event
- Yield to the main thread
- Track FS event
Every time we call the yieldToMain, it creates a separate task and opens space to run other operations in the main thread.
The results were promising. We got a 19% improvement (shaved >120ms), which's huge for INP, but we still had a lot of work to do because the score was still bad.
React re-rendering: debounce
This section will be big! Mostly because we had (and still have) so many re-rendering problems and solving a big portion of it took a lot of time.
In the next section, I'll share the learnings I got while doing all these optimizations but let's focus on the problems and how I solved them.
The first perf runtime problem I spotted was related to the “Show Map” button on the search page.
The "Show Map" button was re-rendering quite a lot while scrolling the SRP list. But why was it re-rendering? Let's see the code first:
import { useEffect, useState } from 'react';

import throttle from 'lodash/throttle';

export const useScrollPosition = () => {
  const [scrollPosition, setScrollPosition] = useState(window.scrollY);
  const [bodyHeight, setBodyHeight] = useState(document.body.clientHeight);

  useEffect(() => {
    const callback = throttle(() => {
      setScrollPosition(window.scrollY);
    }, 300);
    window.addEventListener('scroll', callback);

    const observer = new ResizeObserver(() => {
      setBodyHeight(document.body.clientHeight);
    });
    observer.observe(document.body);

    return () => {
      observer.disconnect();
      window.removeEventListener('scroll', callback);
    };
  }, []);

  return {
    scrollY: scrollPosition,
    bodyHeight,
  };
};
This is what's happening:
- The component calls
useScrollPosition - The hook calculates the scroll Y position in each scroll
- The hook calculates the body height in each scroll
Two components used this hook and none of them needed the body height. I chose the option to remove the need to calculate the body height (if we need it in the future, we'd create a separate hook for it).
The other part of the improvement is replacing the throttle with debounce. While scrolling, the throttle function will keep calculating the scroll Y position from the interval of 300ms. With debounce, we only calculate the position after stopping the scrolling making it smoother.
Here's the code:
import { useEffect, useState } from 'react';

import debounce from 'lodash/debounce';

export const useScrollPosition = () => {
  const [scrollPosition, setScrollPosition] = useState(window.scrollY);

  useEffect(() => {
    const callback = debounce(() => {
      setScrollPosition(window.scrollY);
    }, 300);

    window.addEventListener('scroll', callback);

    return () => {
      window.removeEventListener('scroll', callback);
    };
  }, []);

  return {
    scrollY: scrollPosition,
  };
};
And this is what the change looks like side by side:
React re-rendering: router
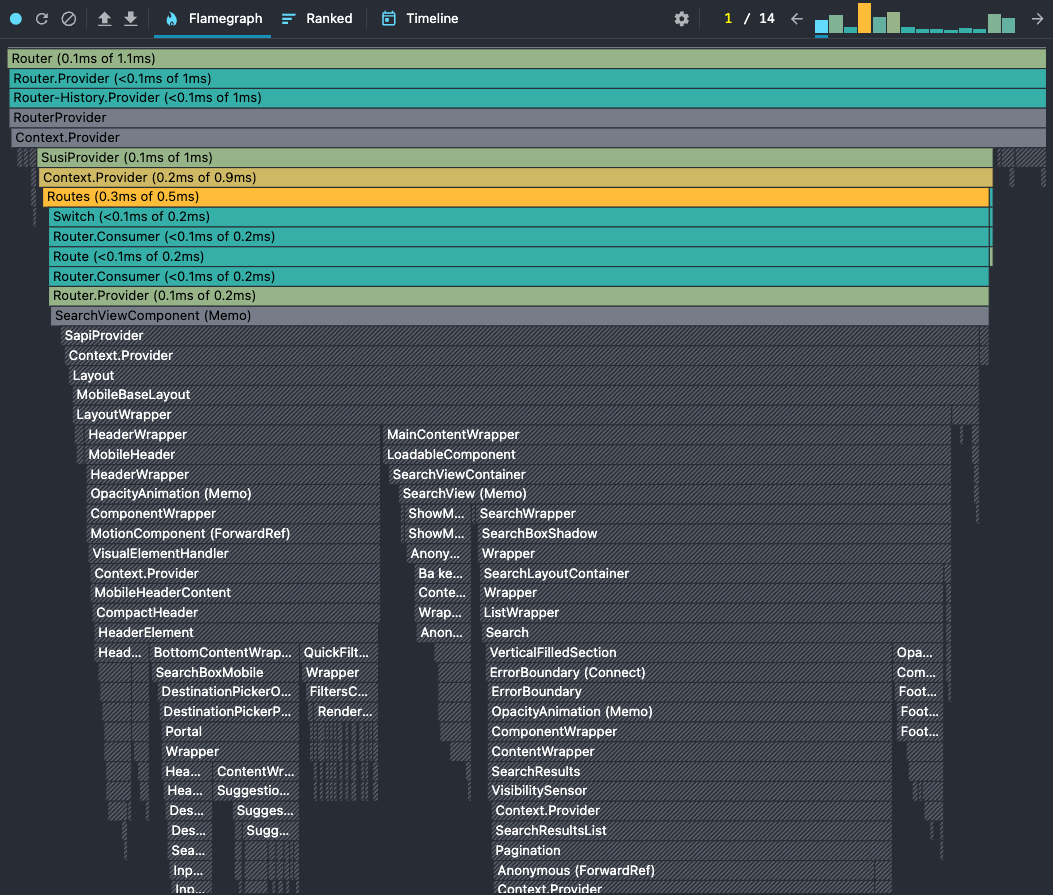
The second problem I spotted was the re-rendering of many components that didn't have any relation with the interaction. The interaction in this case was the click on the hotel card and it opens the hotel details overlay. But for some reason, it was triggering a render for the mobile header, the search box, the hotel card, and many other components.
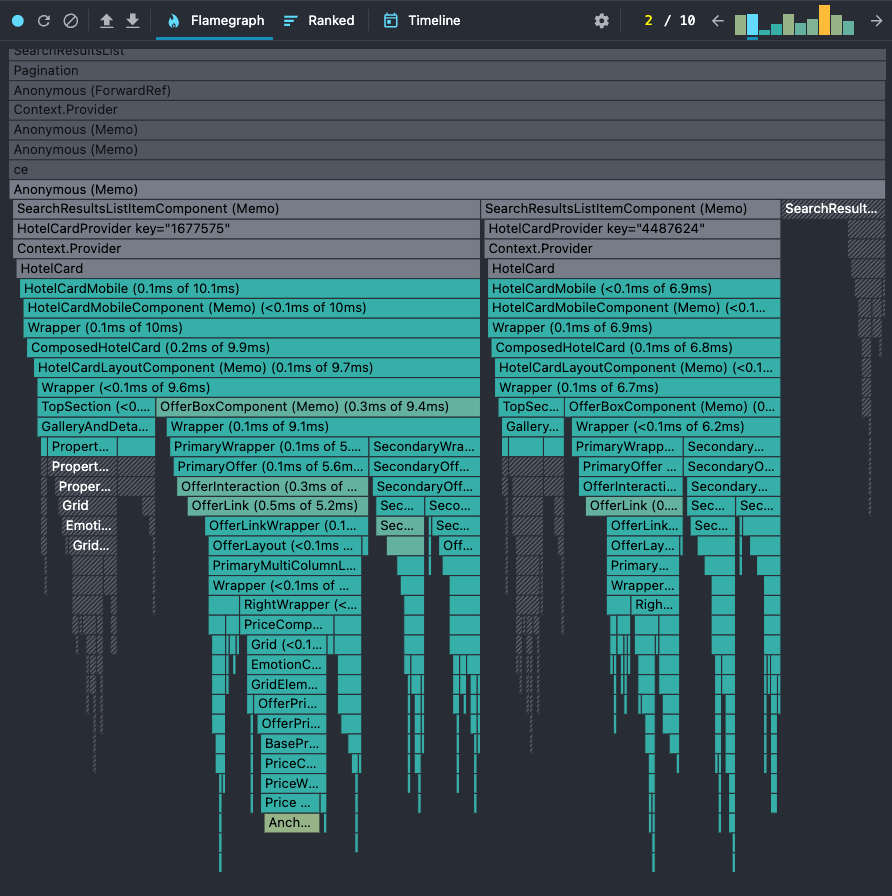
The biggest reason was the fact that our application uses the history API to store the current state of overlays in the application. It has a list of overlays that are opened; if the list is empty, it means there's no open overlay in the app.
We use react-router to handle the history push/pop/replace new states. That means it triggers a re-render for any component that's using the react-router APIs like useLocation, useRouteMatch, useHistory, etc. That was causing major re-rendering issues in the application.
Replacing the location reference from useLocation with the window.location stopped the re-rendering for most of the components. I also cached some components to avoid the re-rendering especially because they didn't have any props being changed — a so-called unnecessary re-rendering.
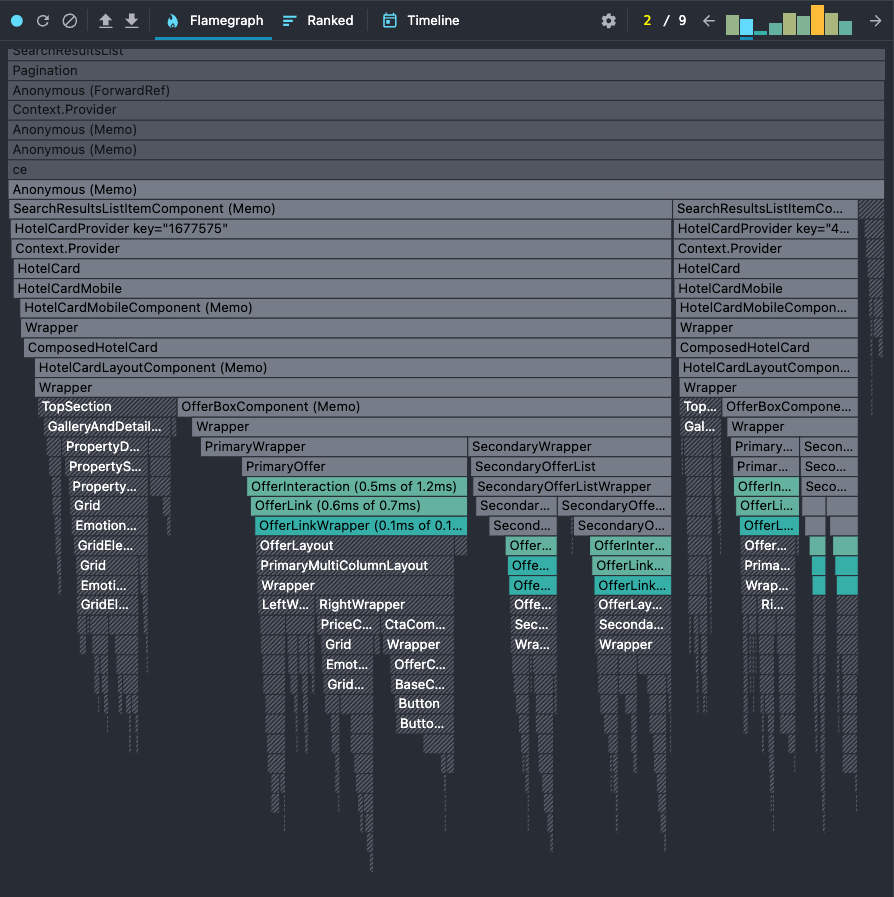
This is the improvement we've got for the mobile header and children components: before on the left and after on the right.
And this is the improvement we've got for the hotel card component:
There are still some components that we need to check there but I'll dive into that later in this post because it was a whole nother performance optimization trip.
The first and second flamechart problems were solved but they required a great amount of time debugging and understanding the underlying problem.
The results were awesome! We shaved more than 1.4s from our custom performance metric: opening the hotel details overlay.
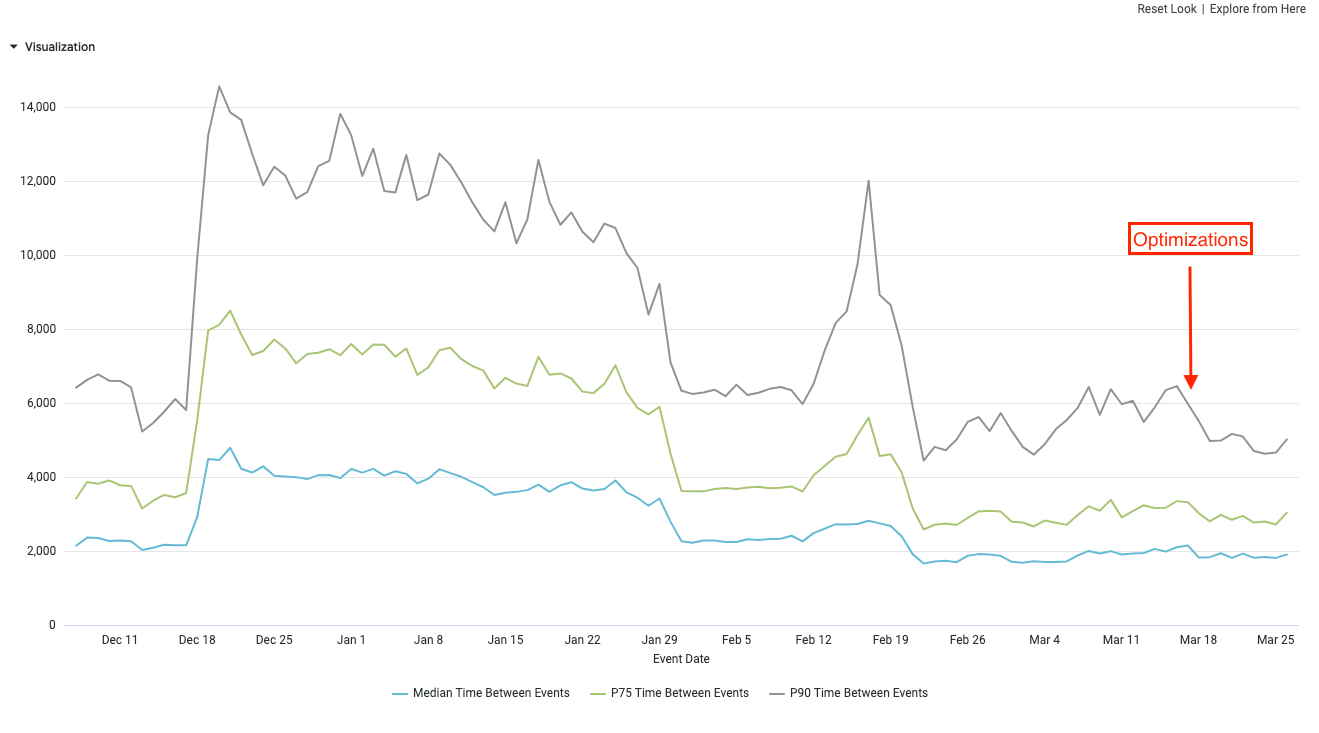
And with this optimization, we finally reached a ‘needs-improvement’ score for INP. That was a huge improvement for us as this score was pretty bad 6 months ago. At that point, it was still not good enough but we were progressing in the right direction.
React re-rendering: colocating functions
Back to the debugging process, I noticed in the React Profiler that we had a component called DealFreeze being re-rendered. I also checked in the devtools performance tab and found the call for some of the functions.
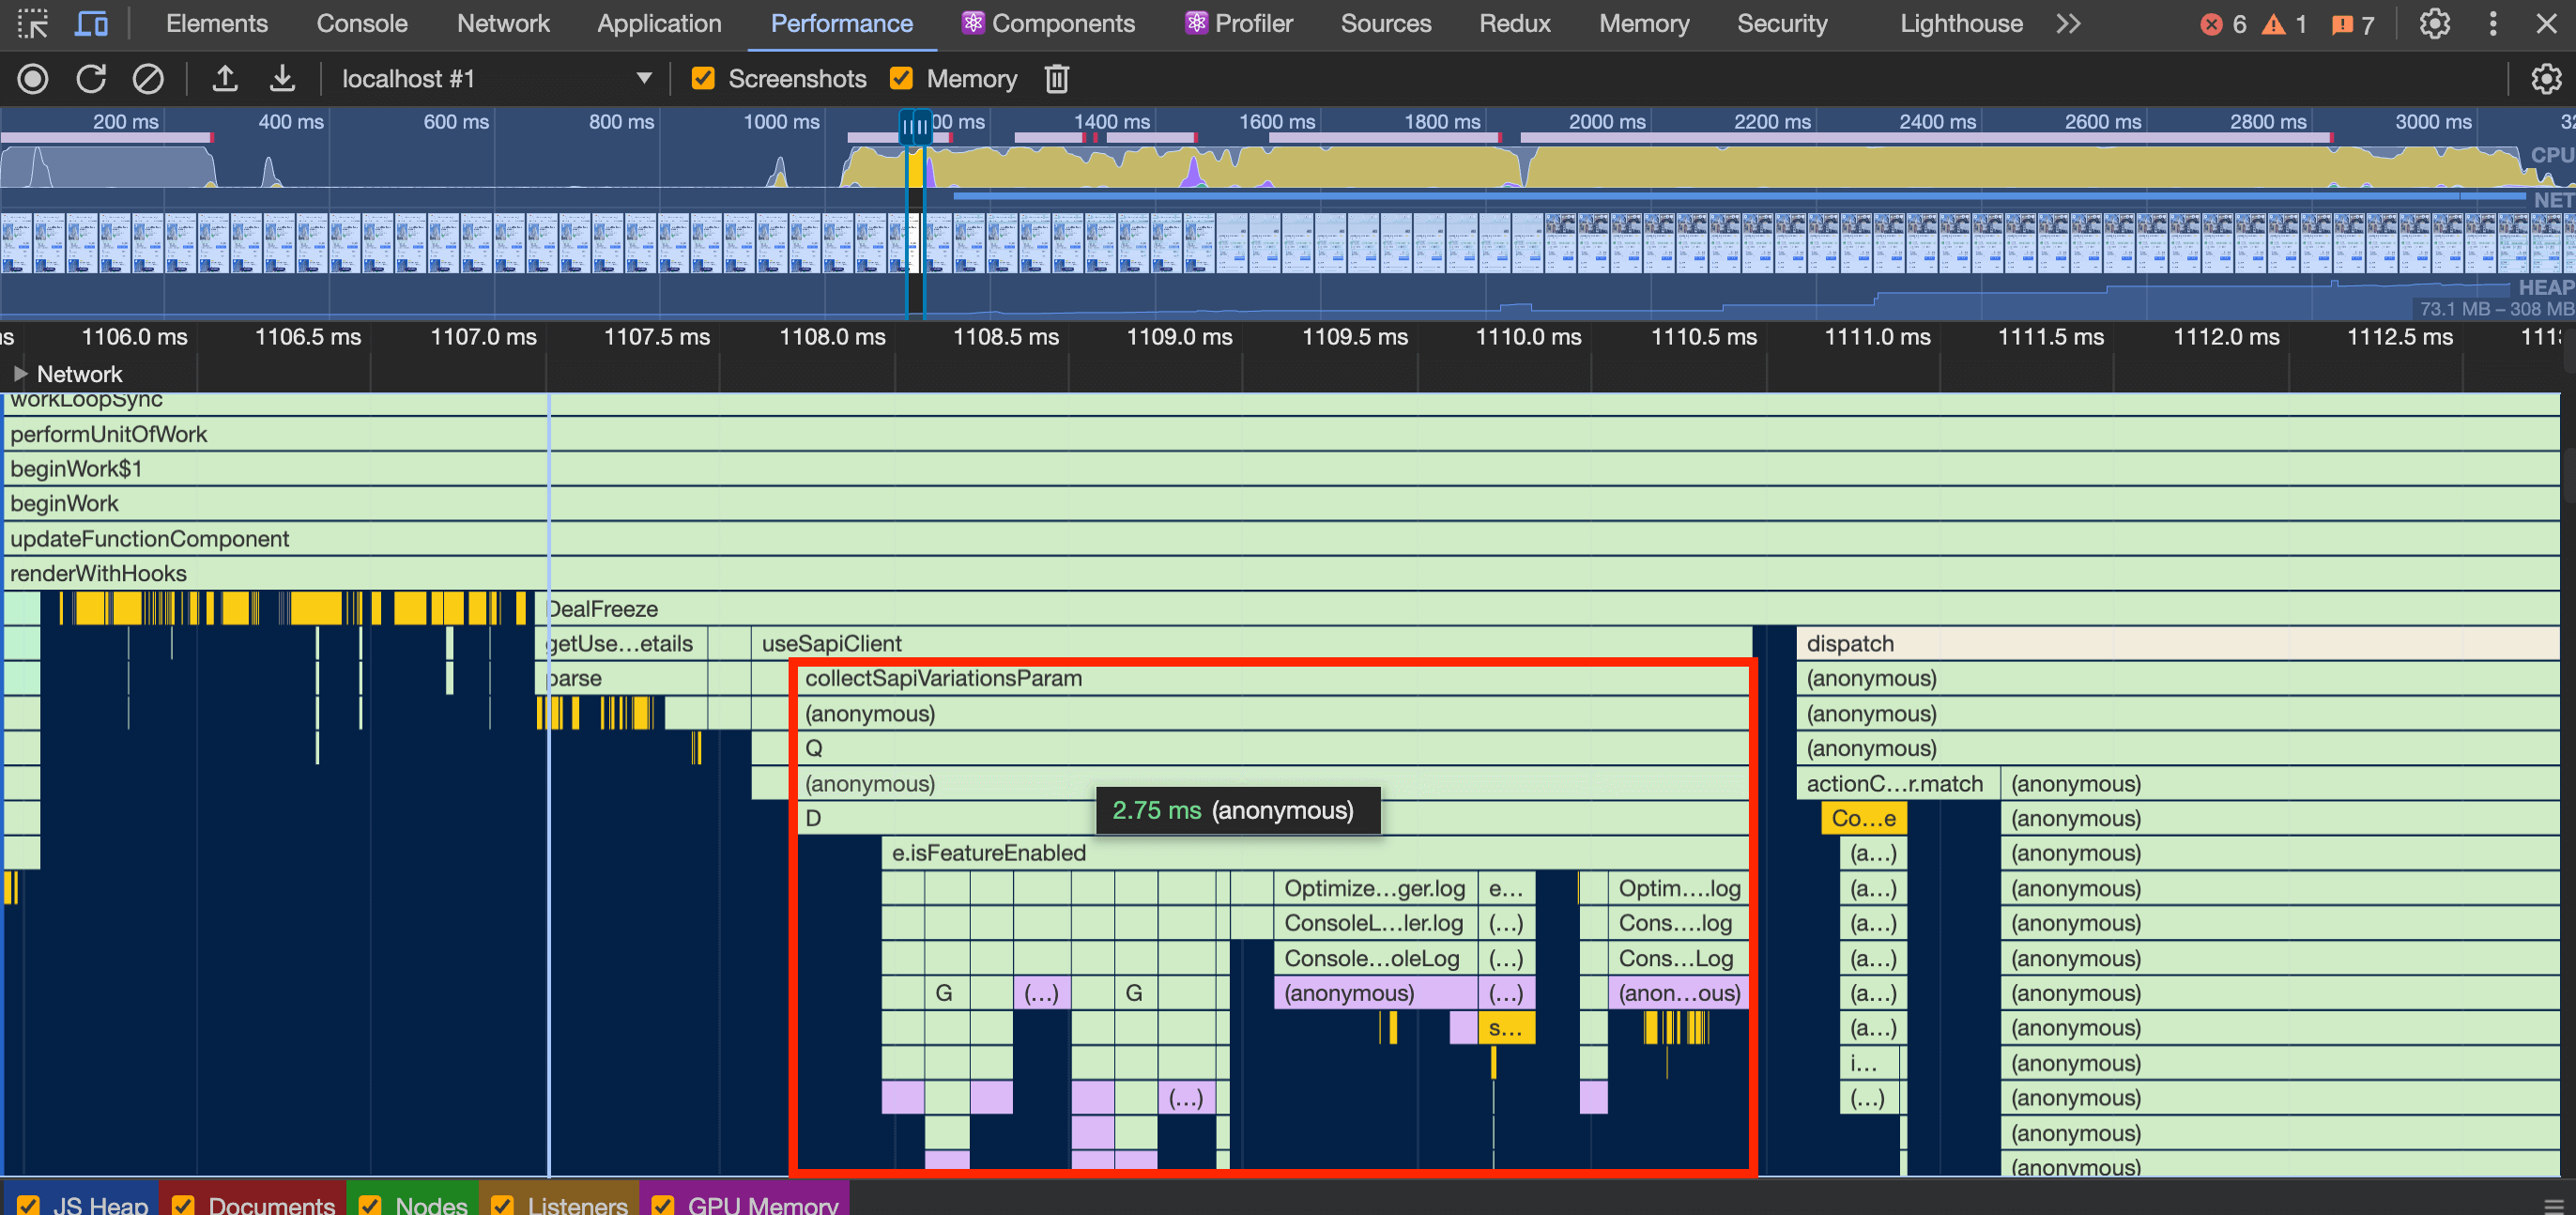
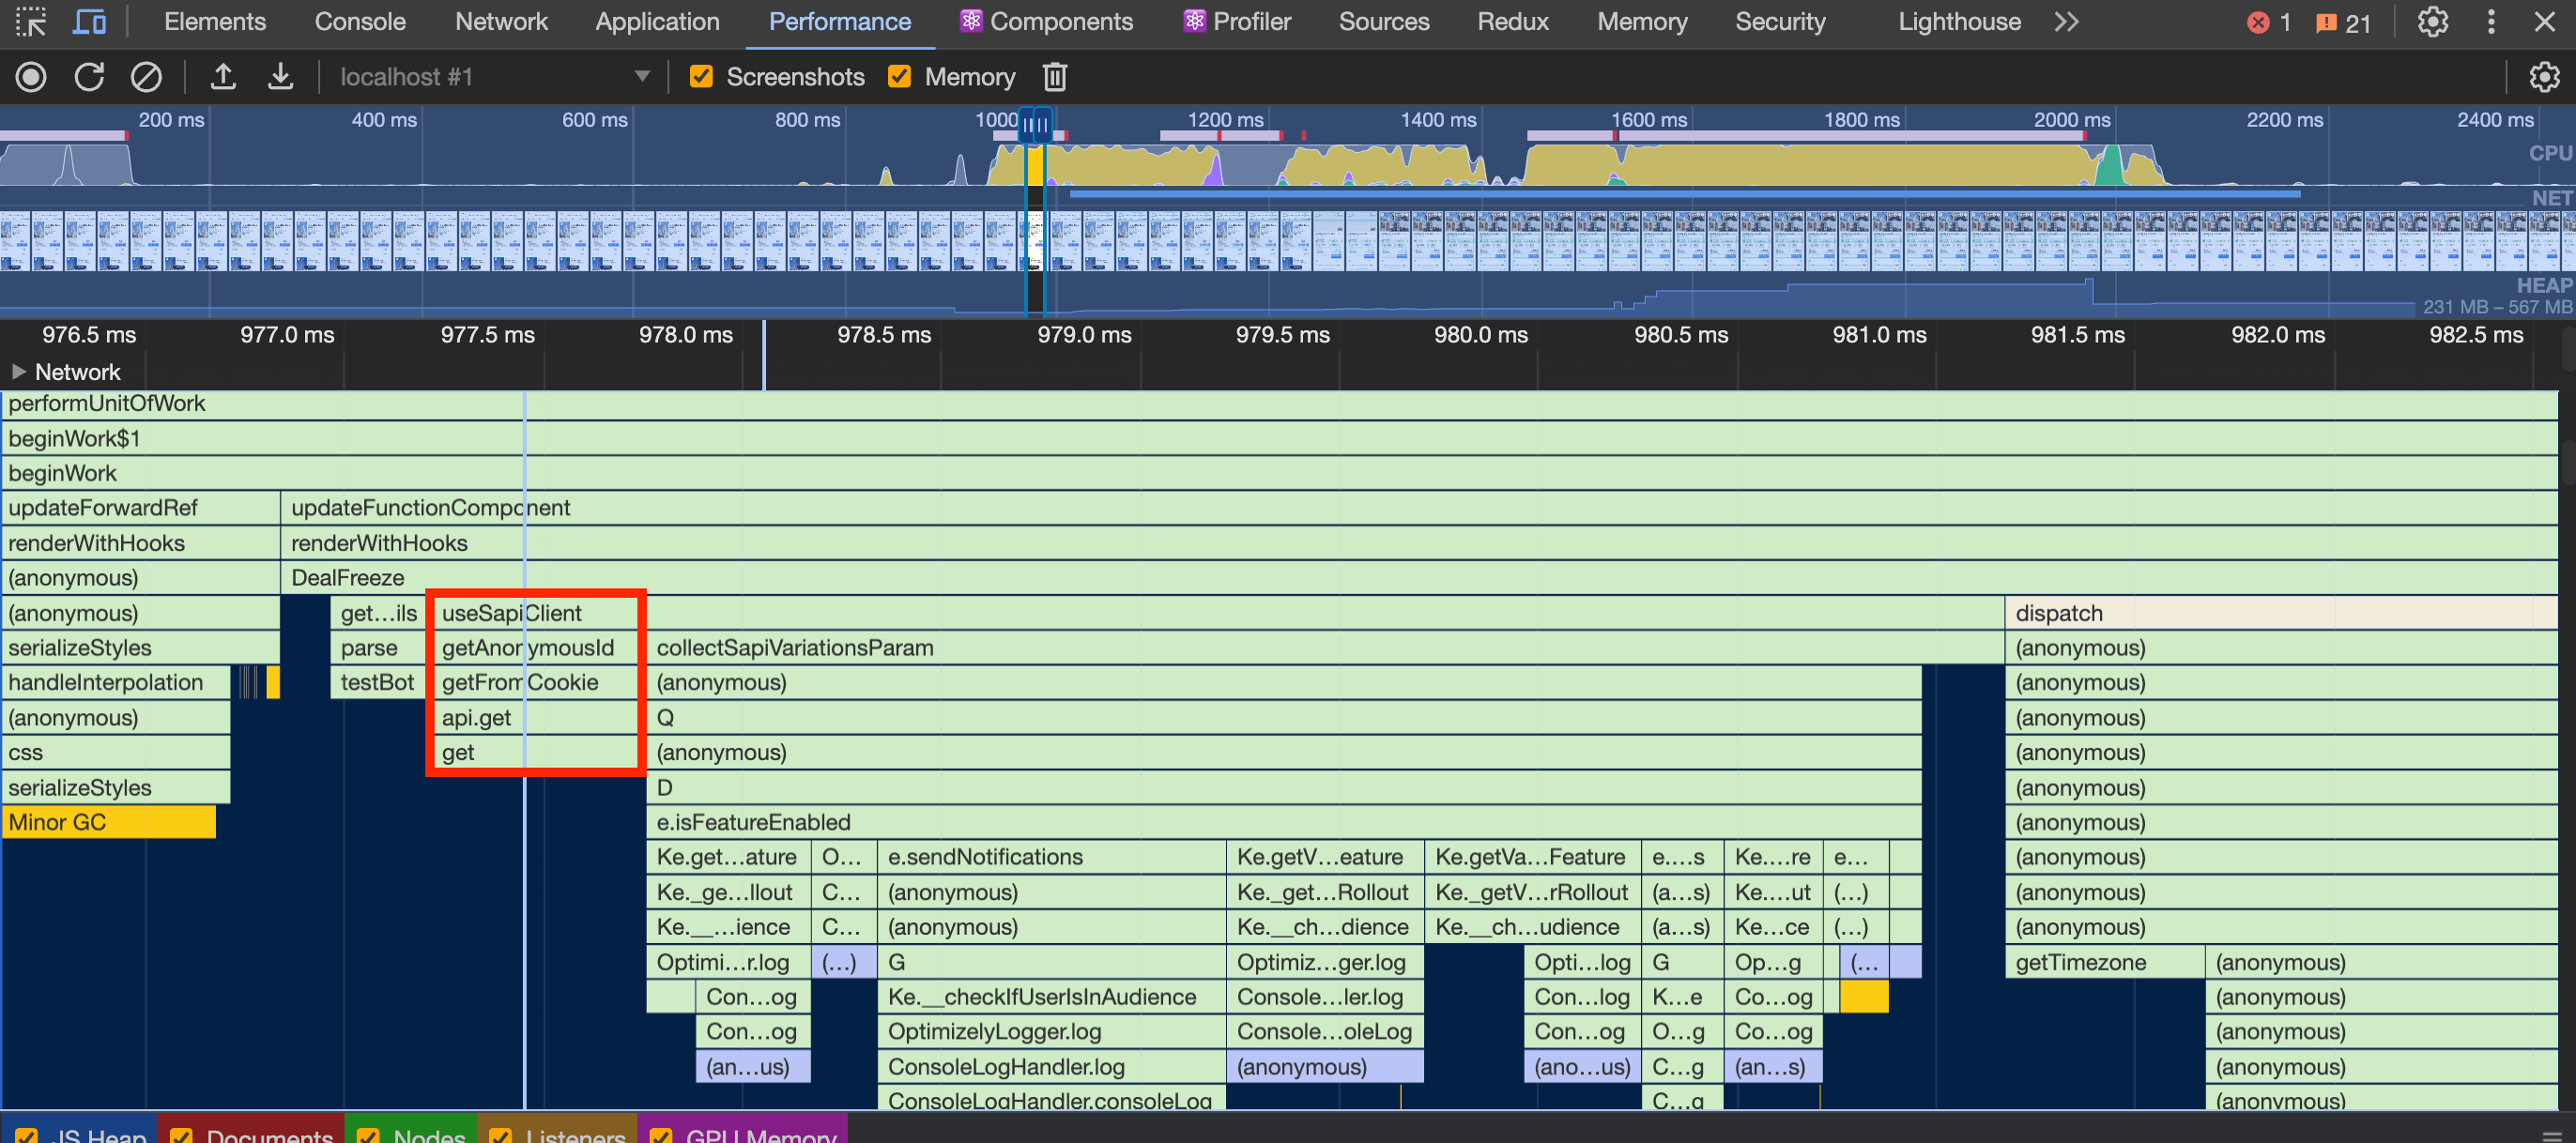
These were the main issues:
collectSapiVariationsParam: this function is unnecessarily called again when opening the hotel details overlay.getDeviceCategory&getAnonymousId: the parsing is run again. Should be run only if the SAPI client is being created for the first time.dispatch: dispatchingsetDealFreezeEnabledto set if the deal freeze feature is enabled
All three problems I solved with one solution: wrapping them into a useEffect. Why? Because:
- We colocate the functions where they are used so they are called only when needed
- We run only one time even if the component re-renders
For example:
export const useSapiClient = ({
  sapiProfileKey,
  currency,
  deviceType
}: SapiClientOptions) => {
  const [sapiClient, setSapiClient] = useState<SapiClient | null>(null)
  const language = useSelector(getLanguageCode)
  const countryCode = useSelector(getCountryCode)
  const anonymousId = getAnonymousId() as string
  const dataFile = useSelector(getDataFile)
  const variations = collectSapiVariationsParam(
    dataFile?.featureFlags.map(({key}) => key)
  )

  useEffect(() => {
    if (sapiClient || !currency) return

    async function createSapiClient() {
      try {
        const client = await sapi(sapiProfileKey, {
          countryCode,
          language,
          currency: currency as string,
          deviceType,
          anonymousId,
          variations
        })
        setSapiClient(client)
      }
    }

    createSapiClient()
  }, [
    // ...
  ])

  // ...
}
It's easy to spot that we only use the anonymousId and the variations inside the useEffect. So, instead of calling these functions every time we run the useSapiClient, we move them within the useEffect so they will be called only one time.
This is the code:
export const useSapiClient = ({
  sapiProfileKey,
  currency
}: SapiClientOptions) => {
  const [sapiClient, setSapiClient] = useState<SapiClient | null>(null)
  const language = useSelector(getLanguageCode)
  const countryCode = useSelector(getCountryCode)
  const dataFile = useSelector(getDataFile)

  useEffect(() => {
    if (sapiClient || !currency) return

    async function createSapiClient() {
      try {
        const userAgentDetails = new UserAgent().parse(navigator.userAgent)
        const deviceType = getDeviceCategory(userAgentDetails)
        const anonymousId = getAnonymousId() as string
        const variations = collectSapiVariationsParam(
          dataFile?.featureFlags.map(({key}) => key)
        )

        const client = await sapi(sapiProfileKey, {
          countryCode,
          language,
          currency: currency as string,
          deviceType,
          anonymousId,
          variations
        })
        setSapiClient(client)
      }
    }
    createSapiClient()
  }, [
    // ...
  ])

  // ...
}
I did the very same idea for the dispatch of the setDealFreezeEnabled action. As this is part of a provider and it's used in many parts of the application, we had nice results and improved the performance metrics for many pages.
We also got a nice improvement in this optimization
- P90: ~29% improvement (shaved ~1363ms in rendering the AP)
- P75: ~22% improvement (shaved ~700ms in rendering the AP)
As I mentioned, this code was used on many pages and it also got a nice improvement in the room details page
- 28% improvement: 700ms → 500ms (shaved ~200ms from INP)
React re-rendering: complex custom hooks
This one we also got nice improvements. Especially because it was a huge bottleneck in our app.
We have a component called OfferInteraction that works like a container for offer components in the hotel card. That way, it provides interactivity when the user clicks the offer: it should open the hotel details overlay, open a sign-in form (if it's a locked offer), redirect to the payments page, and many other possibilities depending on the user and the offer in question. It also handled event tracking for all these possibilities.
To handle all this logic, we had a hook called useOfferInteraction.
Custom hooks in React can be very flexible and powerful but if the abstraction gets bigger and more complex, it is easy to cause performance bottlenecks. That was the case of our useOfferInteraction hook.
We were calling this hook many times and re-rendering the components unnecessarily.
To do this optimization I tried to find all the states that were updated and causing the custom hook to re-render. And there were many states involved in this problem.
The first one was already mentioned before. It is the usage of react-router APIs like useLocation and useHistory. So I replaced all of them with the window.location and window.history.
One example was that we were using the history state to store the list of overlays and we used react-router to handle that for us. Instead of getting from its API, we call directly from the window.history state.
Another part of the optimization was having better memoization for selectors. Rather than relying on object references, we could get only the attributes needed for the selector. Here's an example of this optimization
export const getOptimizedRoomsConfig = createSelector(
  [getHotelOfferEntity, getSearchParameters],
  (hotelOfferEntity, searchParameters) =>
    !searchParameters?.optimizeRooms ||
    (hotelOfferEntity && !hotelOfferEntity.roomsConfig)
      ? searchParameters?.rooms
      : hotelOfferEntity?.roomsConfig,
);
We get the searchParameters from the getSearchParameters selector and then only use two of its attributes: optimizeRooms and rooms, both are numbers. Instead of getting the entire object, it is better to get only the two attributes we need and cache the value so we don't need to calculate it again.
const getOptimizeRooms = createSelector(
  [(state: State) => state.sapiSearch?.searchParameters?.optimizeRooms],
  (optimizeRooms) => optimizeRooms,
);

const getRooms = createSelector(
  [(state: State) => state.sapiSearch?.searchParameters?.rooms],
  (rooms) => rooms,
);

export const getOptimizedRoomsConfig = createSelector(
  [getHotelOfferEntity, getOptimizeRooms, getRooms],
  (hotelOfferEntity, optimizeRooms, rooms) =>
    !optimizeRooms || (hotelOfferEntity && !hotelOfferEntity.roomsConfig)
      ? rooms
      : hotelOfferEntity?.roomsConfig,
);
That way we have better caching for these values, something that we couldn't get with the entire object.
The last part of the bottleneck was because we had a call for another custom hook called useHotelOverlayOffersFilters. The problem with this hook was the fact that it was creating 3 functions and returning them. We were using only one of them and the other one was causing a re-render because the state changed.
The optimization was to make this hook simpler, or most specifically, break it down into three separate hooks and use only one of them, which was not causing the re-render.
After all these optimizations, I measured again with devtools and could see that the bottleneck was gone.
Running the React profiler helped me guarantee that the re-rendering was not an issue anymore:
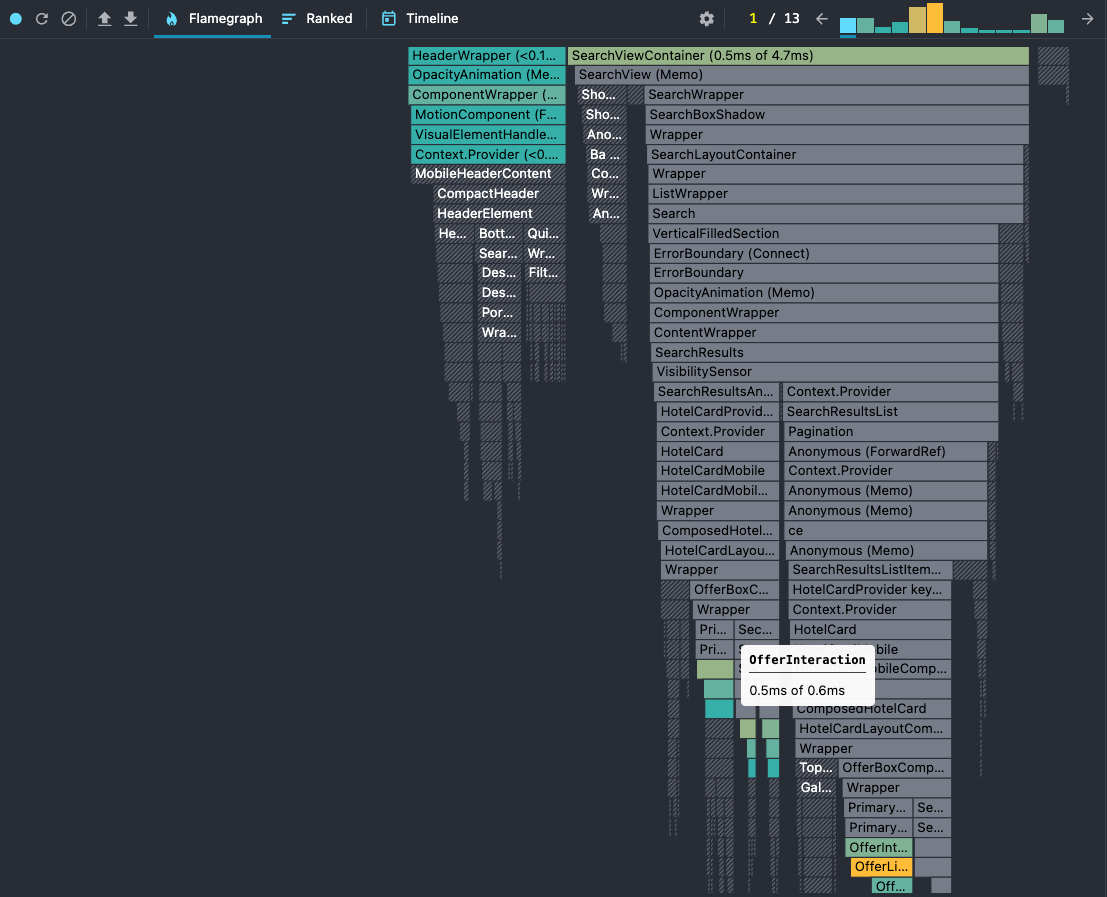
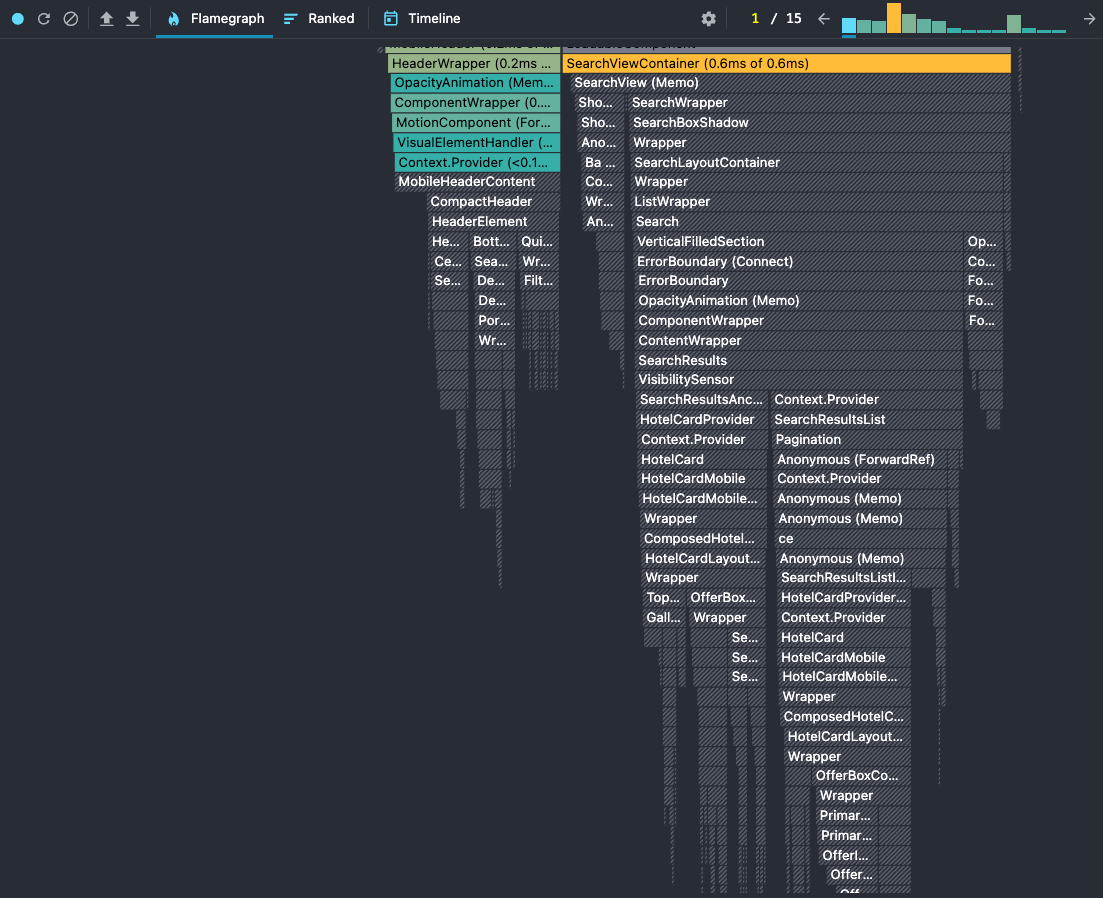
We had a nice improvement on some of the interaction metrics. One of them is when the user opens the search box to perform a new search.
We improved this metric by 25%, shaving around 50ms which was huge.
React re-rendering: selector memoization
Last but not least we have selector memoization. Let's take a look at this problem.
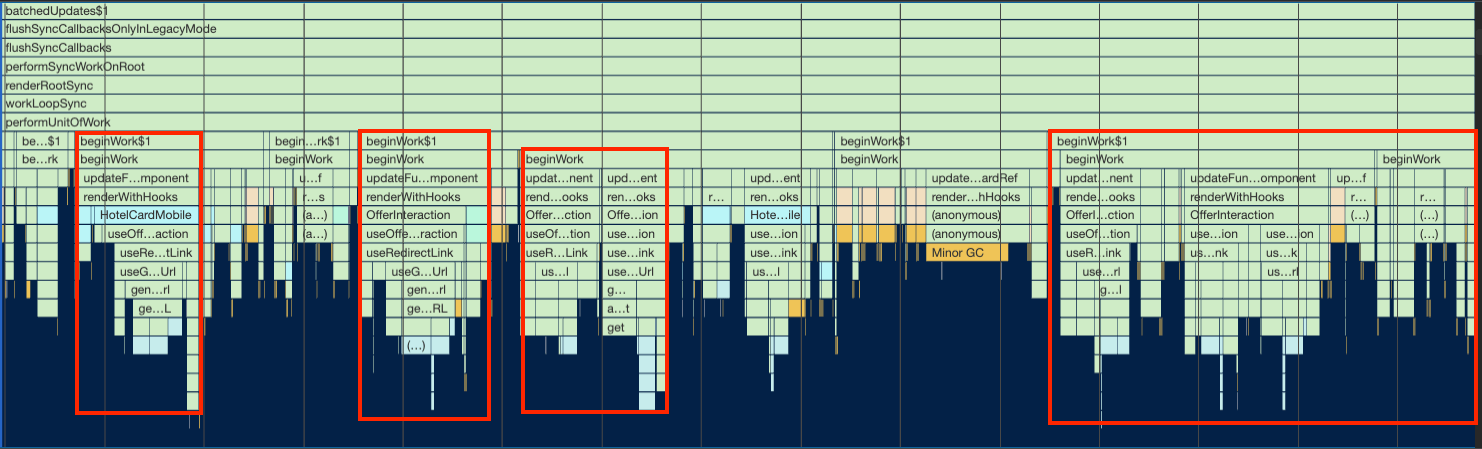
When making any interaction on SRP, there’s a performance bottleneck on React’s render (execute all components and build a new vdom) and commit (apply the new vdom to the actual dom) operations.
When profiling the interactions, it’s easy to spot huge operations related to render and commit:
When we zoom in, we can spot that these issues are related to Redux’s checkForUpdates. That means that Redux is requesting to check some of the selectors for updates.
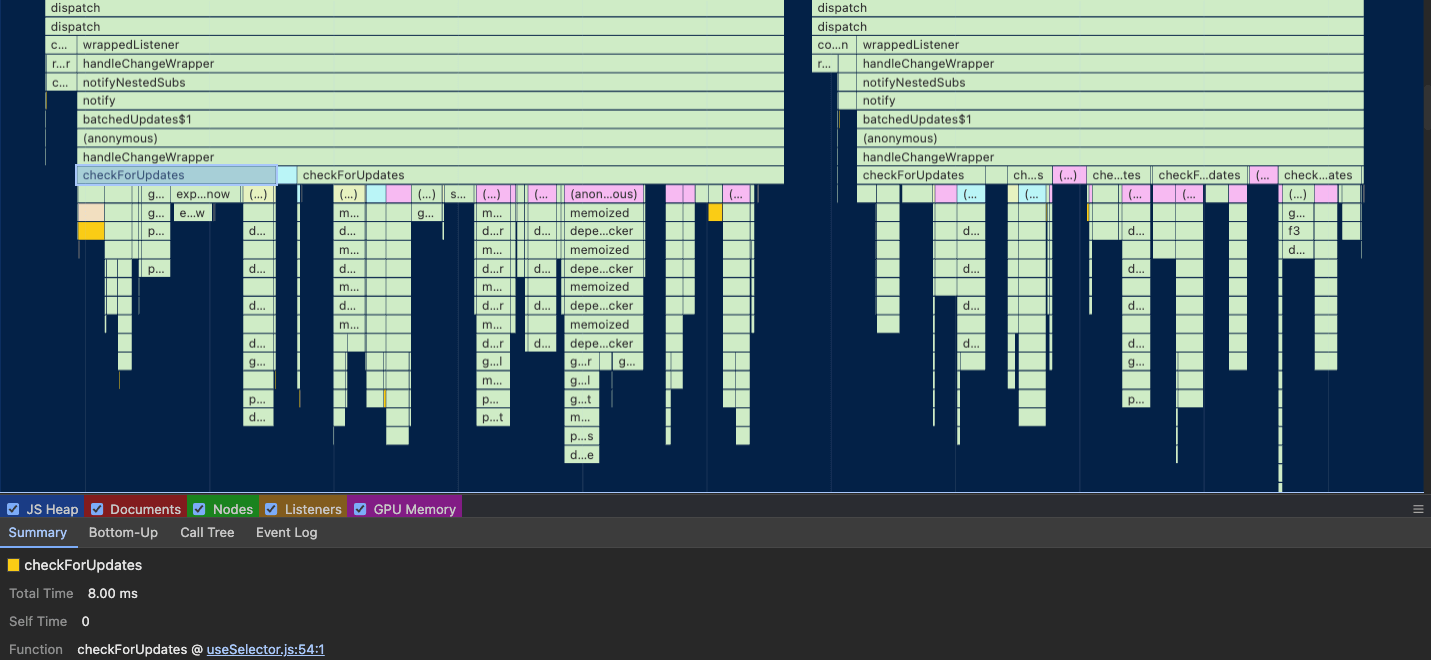
There were two problems here:
- Using
useSelectorfor non-selectors - Not caching selectors when we should
For the first issue, there’s a clear example of the getAnonymousId function:
const anonymousId = useSelector(getAnonymousId);
Because getAnonymousId is not a selector and we were using useSelector, Redux doesn’t know that and will check for updates. It turns out that getAnonymousId will always generate a new value and then we have a bunch of operations for checkForUpdates.
The second issue is the fact that some selectors were not memoized using createSelector (from reselect). Especially for heavy selectors and selectors that rely on objects (rather than simple values), it’s best and recommended to cache those values, so Redux doesn’t need to keep checking and updating them.
This second issue was solved into two parts:
- Using
createSelectorfor non-cached selectors
// Before
export const getIsUserSearch = (state: StateType): boolean =>
  state.search.isUserSearch || false

// After
export const getIsUserSearch = createSelector(
  [(state: StateType) => state.search.isUserSearch],
  isUserSearch => isUserSearch || false
)
- Creating selectors for values over objects and caching them
// Before: get an entire object
export const getHotel = createSelector(
  [getHotelIdParam, getHotelEntities],
  (hotelId, hotelEntities): Hotel | undefined =>
    getHotelById(hotelId, hotelEntities),
);

// After: get only the necessary attribute
export const getHotelName = createSelector(
  [getHotel],
  (hotel) => hotel?.hotelName,
);
This was causing major re-rendering for components when loading the page and after any user interaction. With cached values, we skipped most of the Redux check for updates and freed the main thread to more important operations.
That was the major improvement we made.
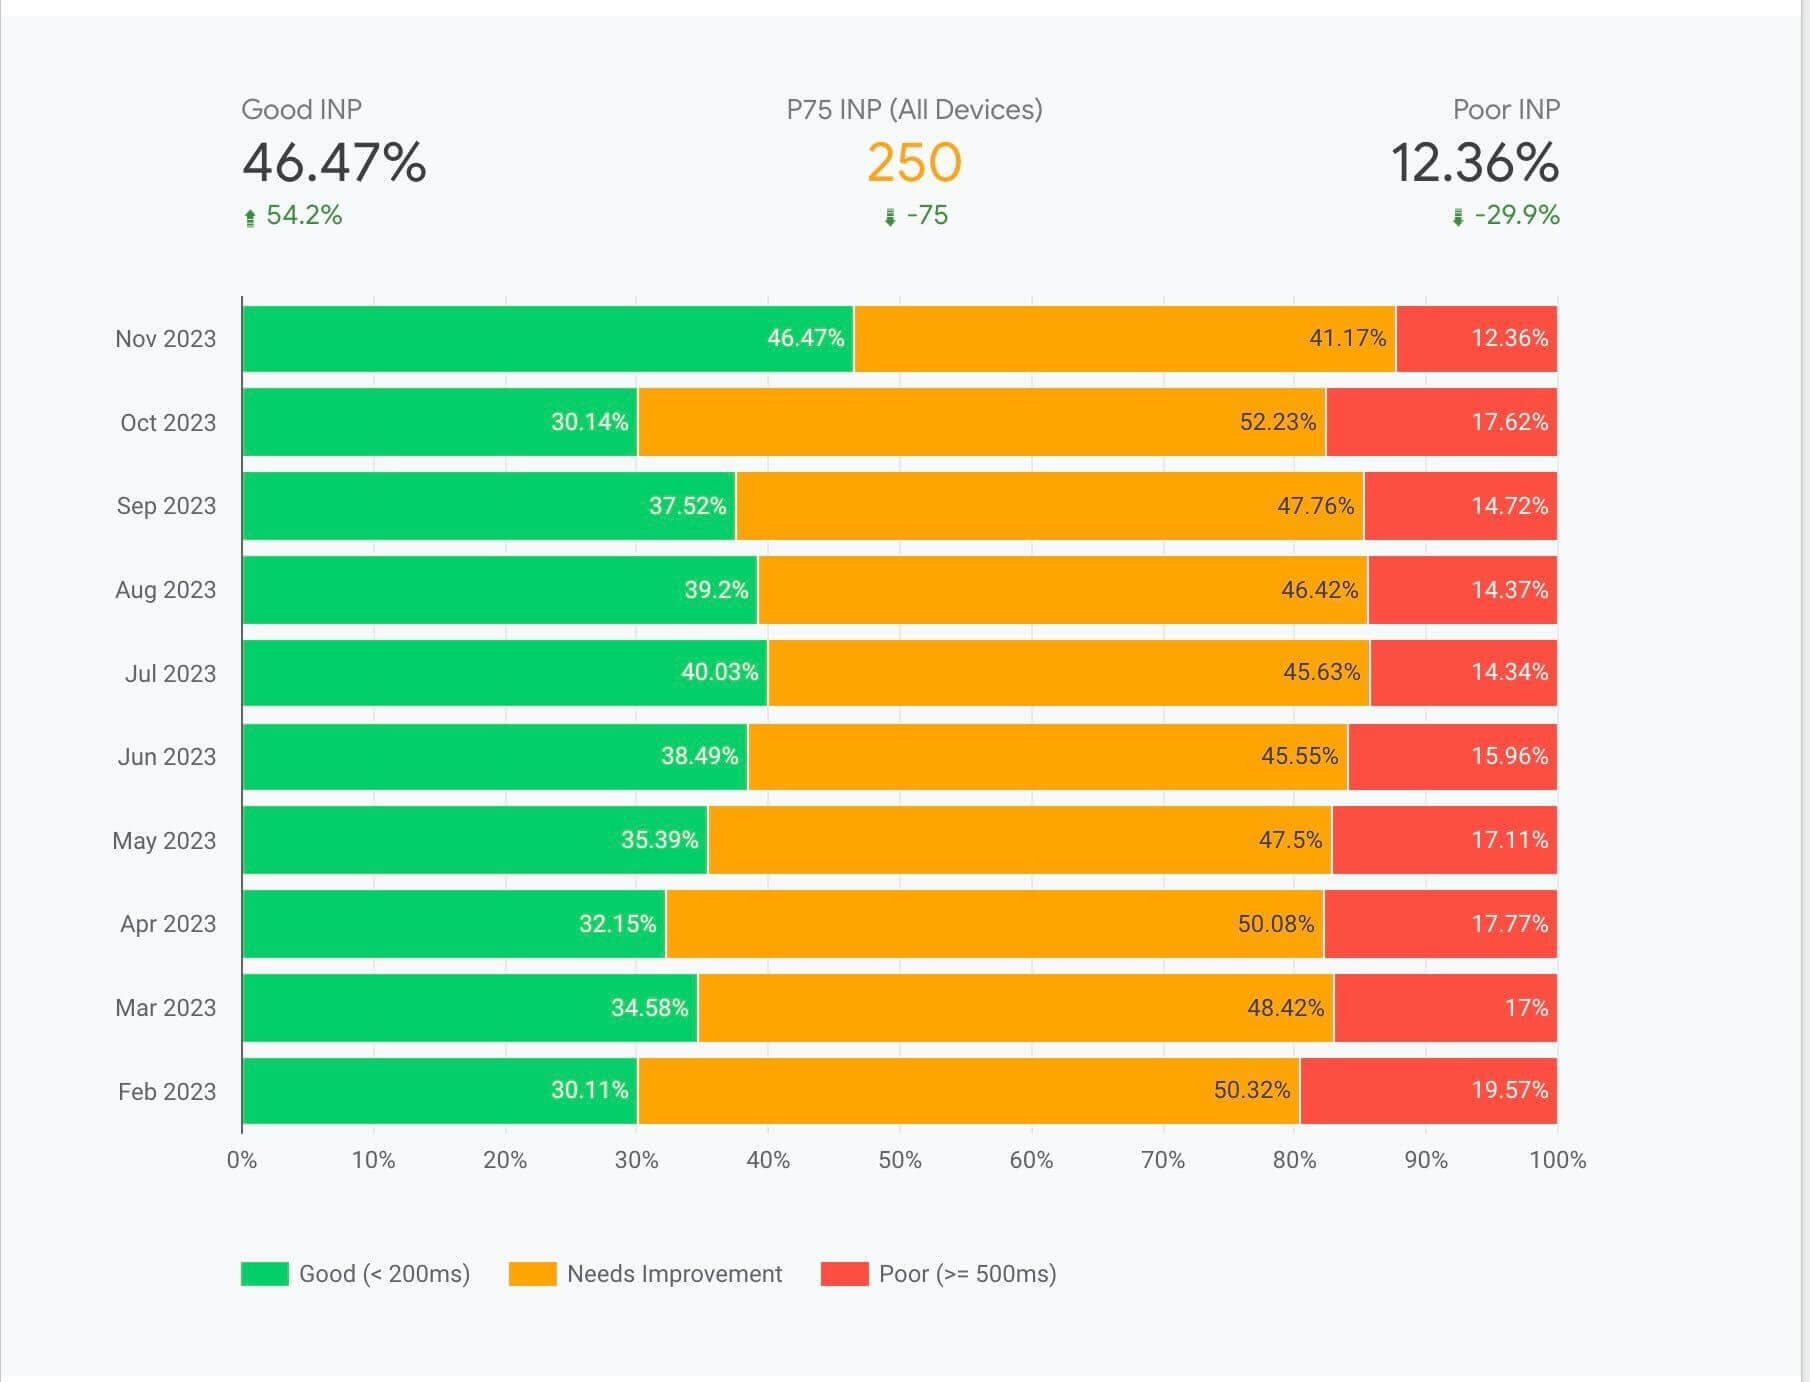
INP in general improved by 45%, going from ~420ms to ~230ms and getting closer to the “good” score.
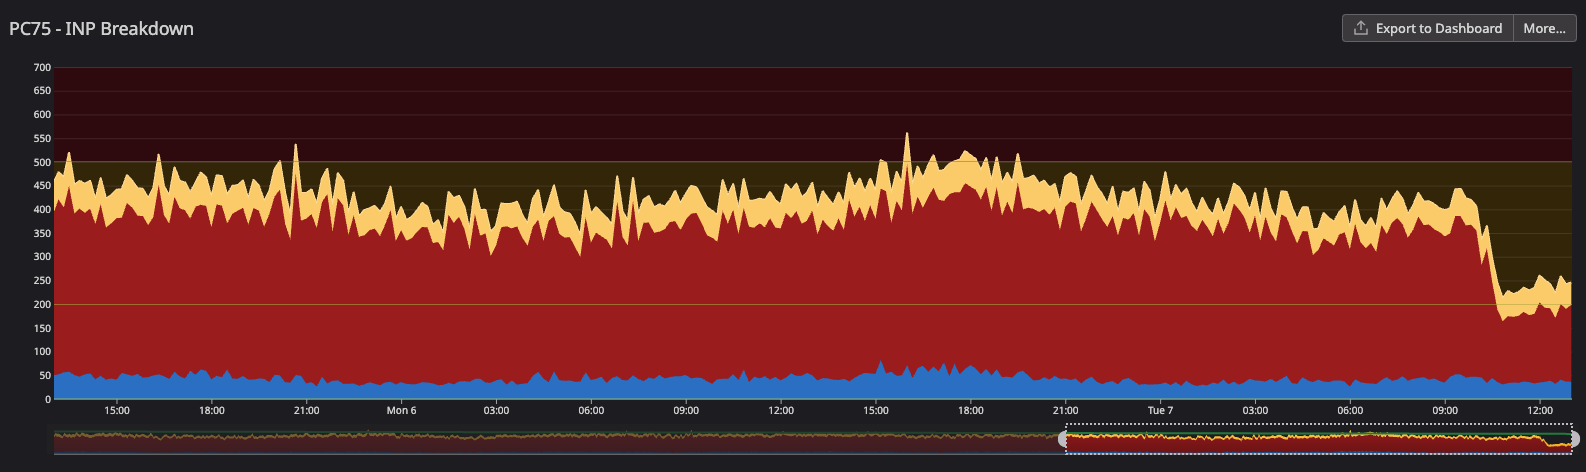
My focus is to improve the performance metrics for mobile, we also have some of the metrics focused only on this device type.
We went from 550ms to 300ms (45% improvement), reached the “needs improvement” score, and it was closer to the “good” score (200ms) and than the “poor” score (500ms)
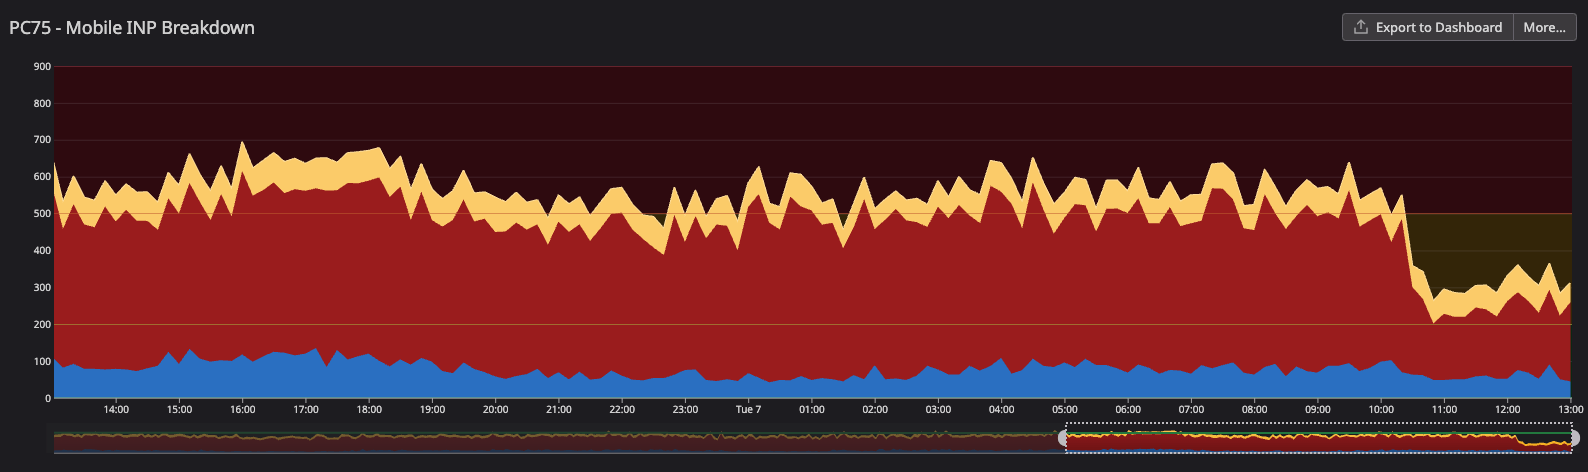
There was also a huge impact on Android App (Webview) performance. It’s the biggest improvement overall in device types (iOS App, iOS Web, Android App, Android Web, Desktop).
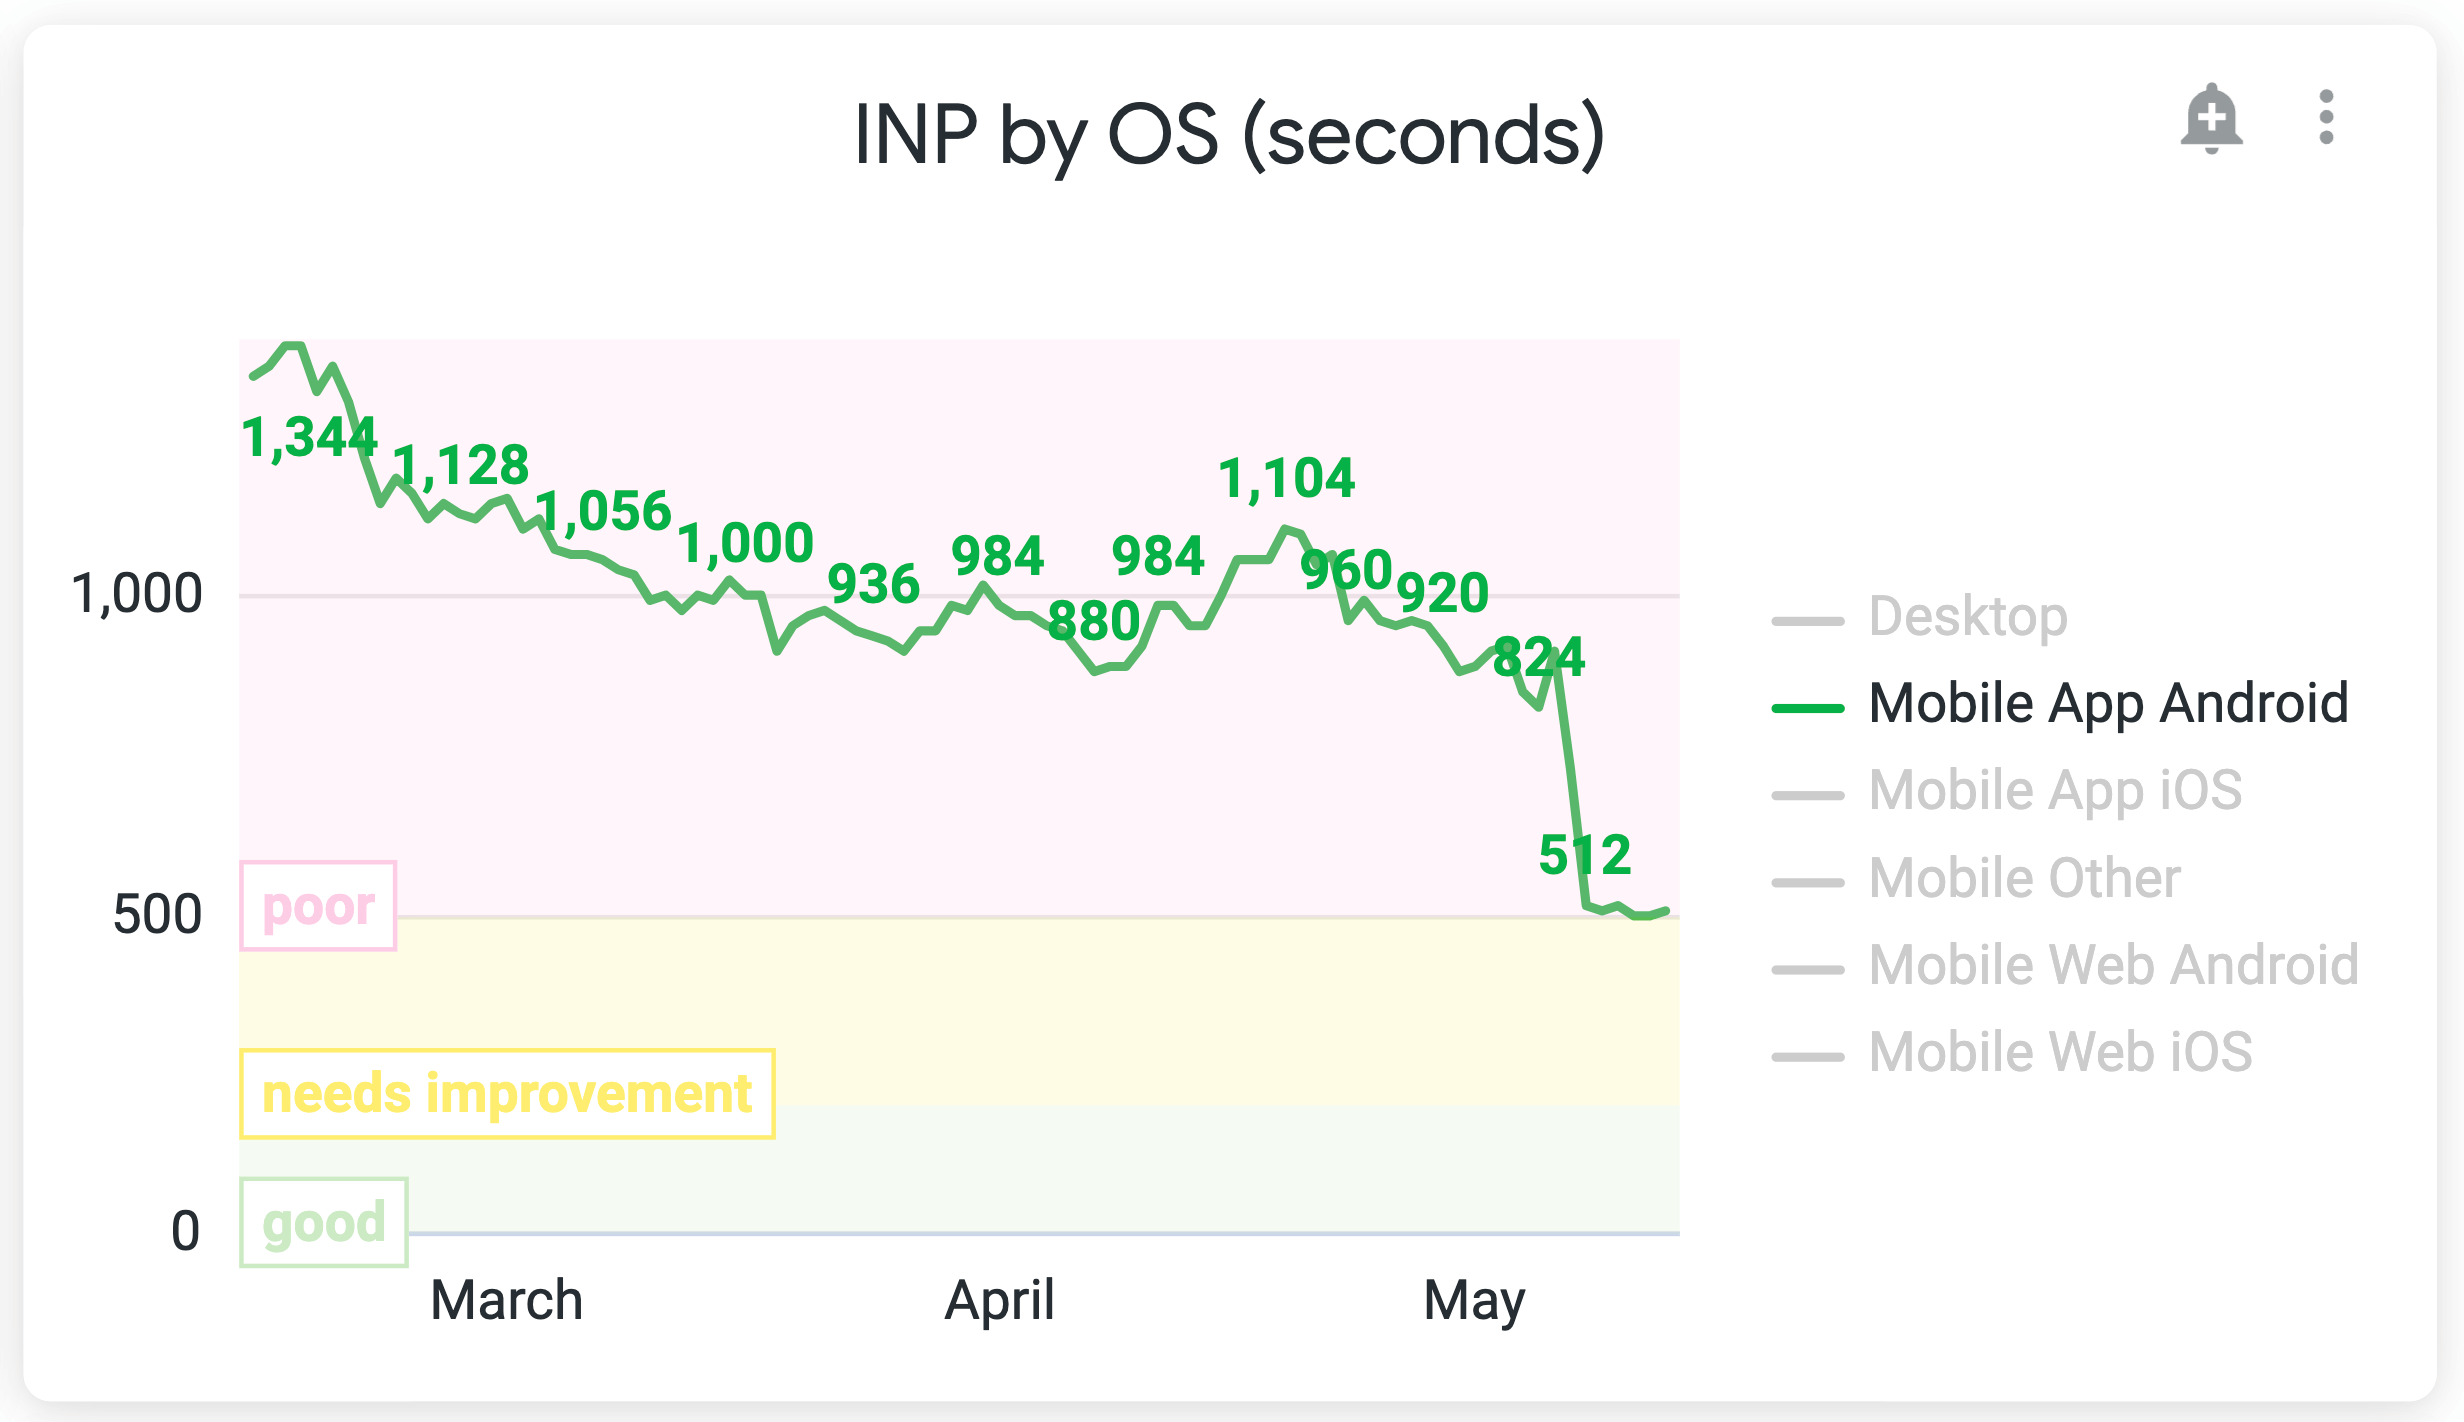
We went from ~900ms to ~500ms, a more than 400ms (44%) improvement.
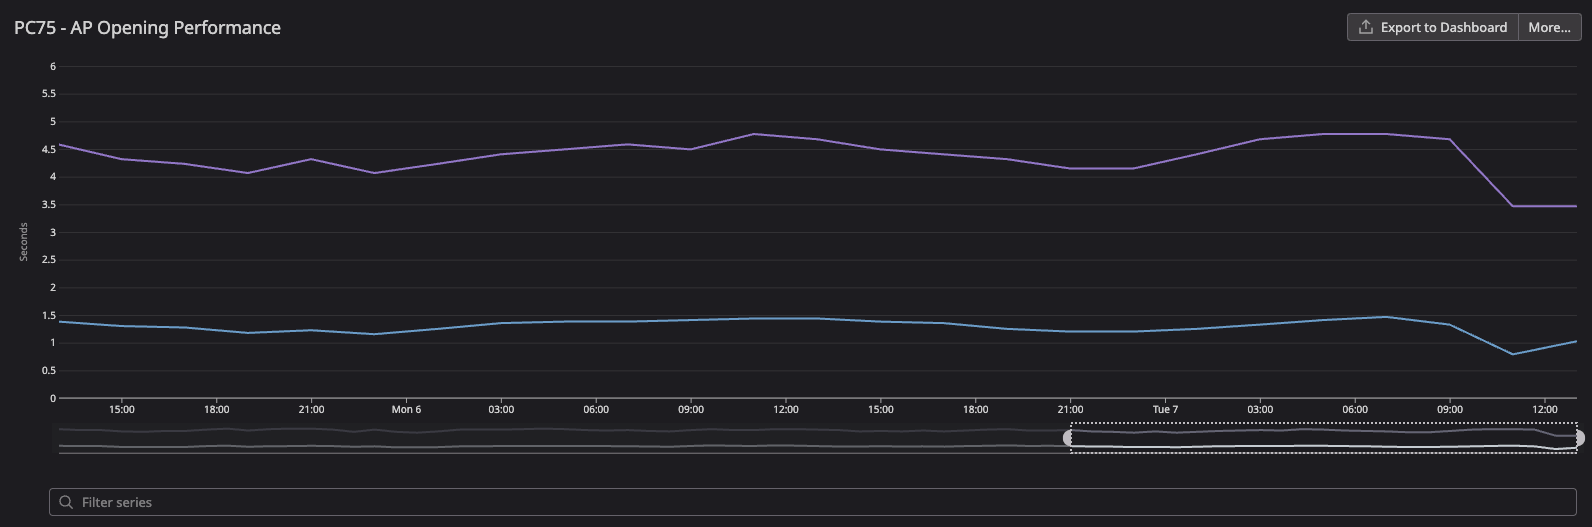
Our custom performance metrics also improved as expected. The hotel details overlay opening metric went down:
- From
4.68sto3.46s(more than 1s improvement: 26%) for AP load - From
1.33sto820ms(38% improvement) for AP ready
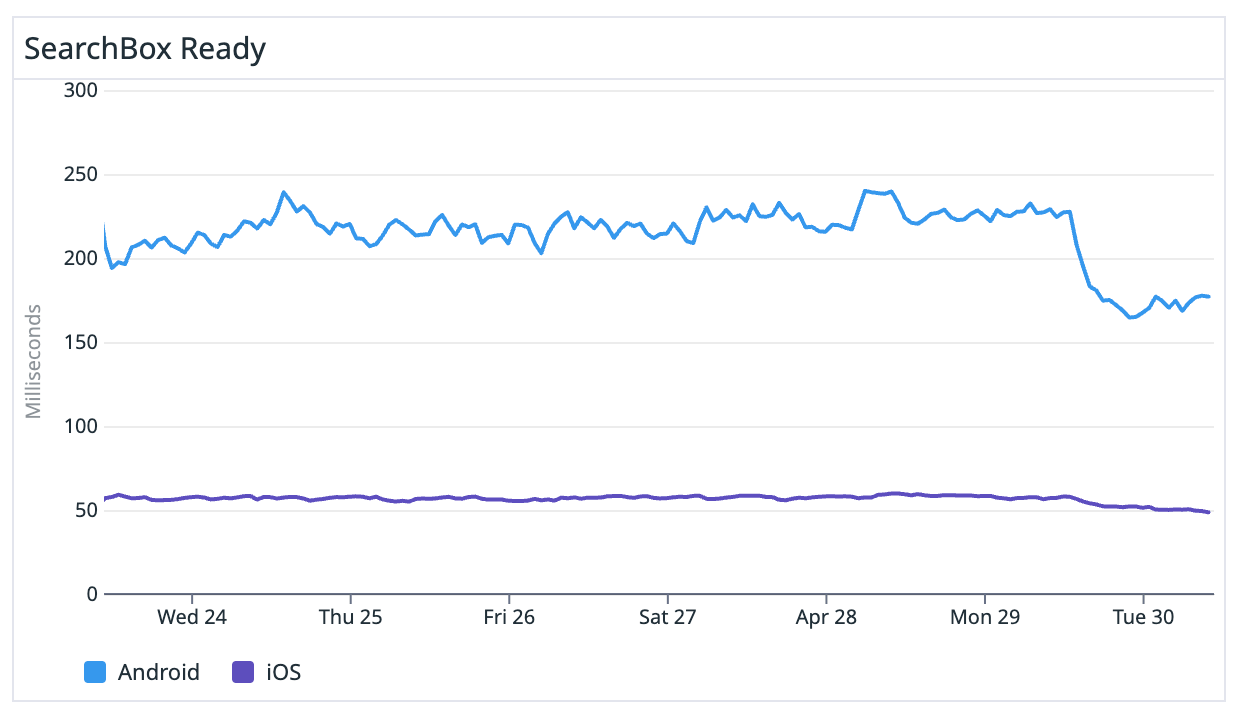
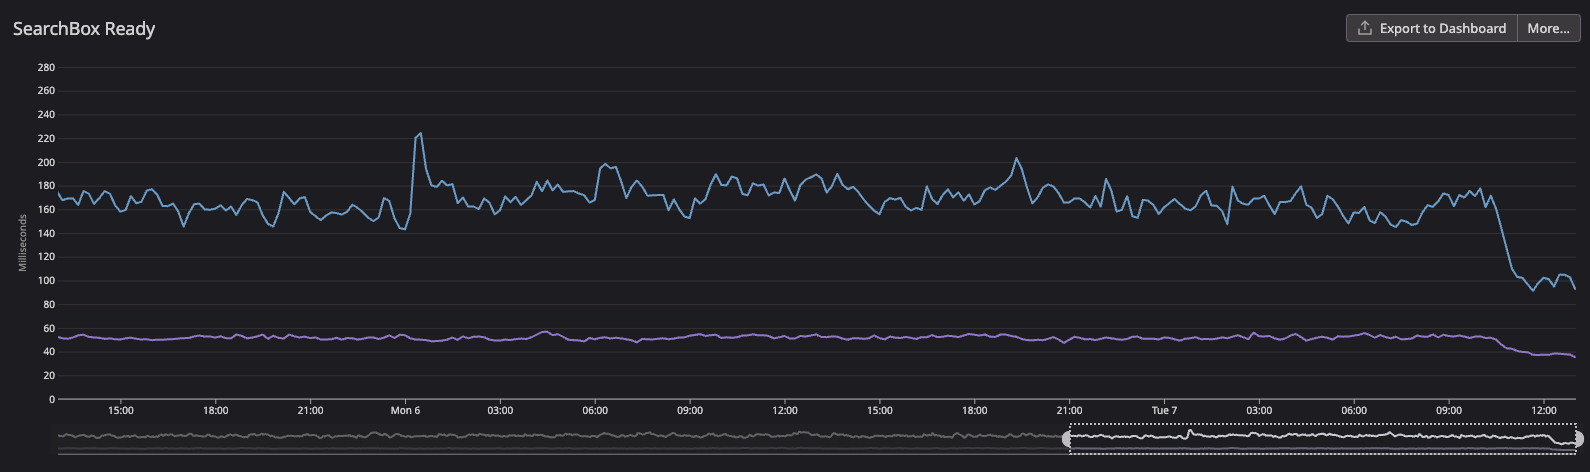
The search box metric also improved:
- From
171msto94ms(45% improvement) for Android - From
51msto37ms(27% improvement) for iOS
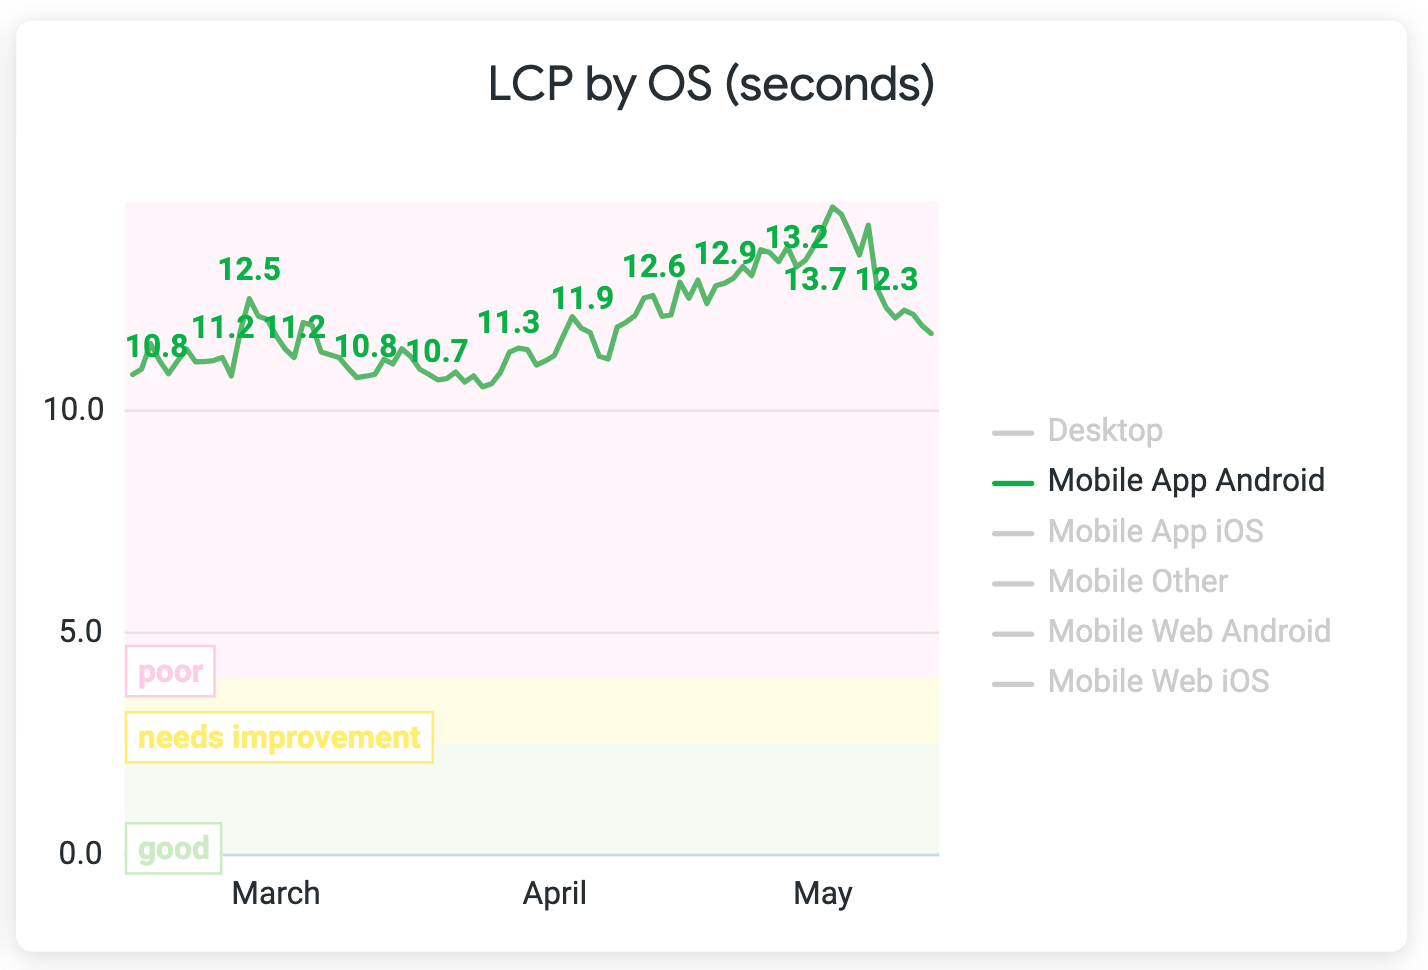
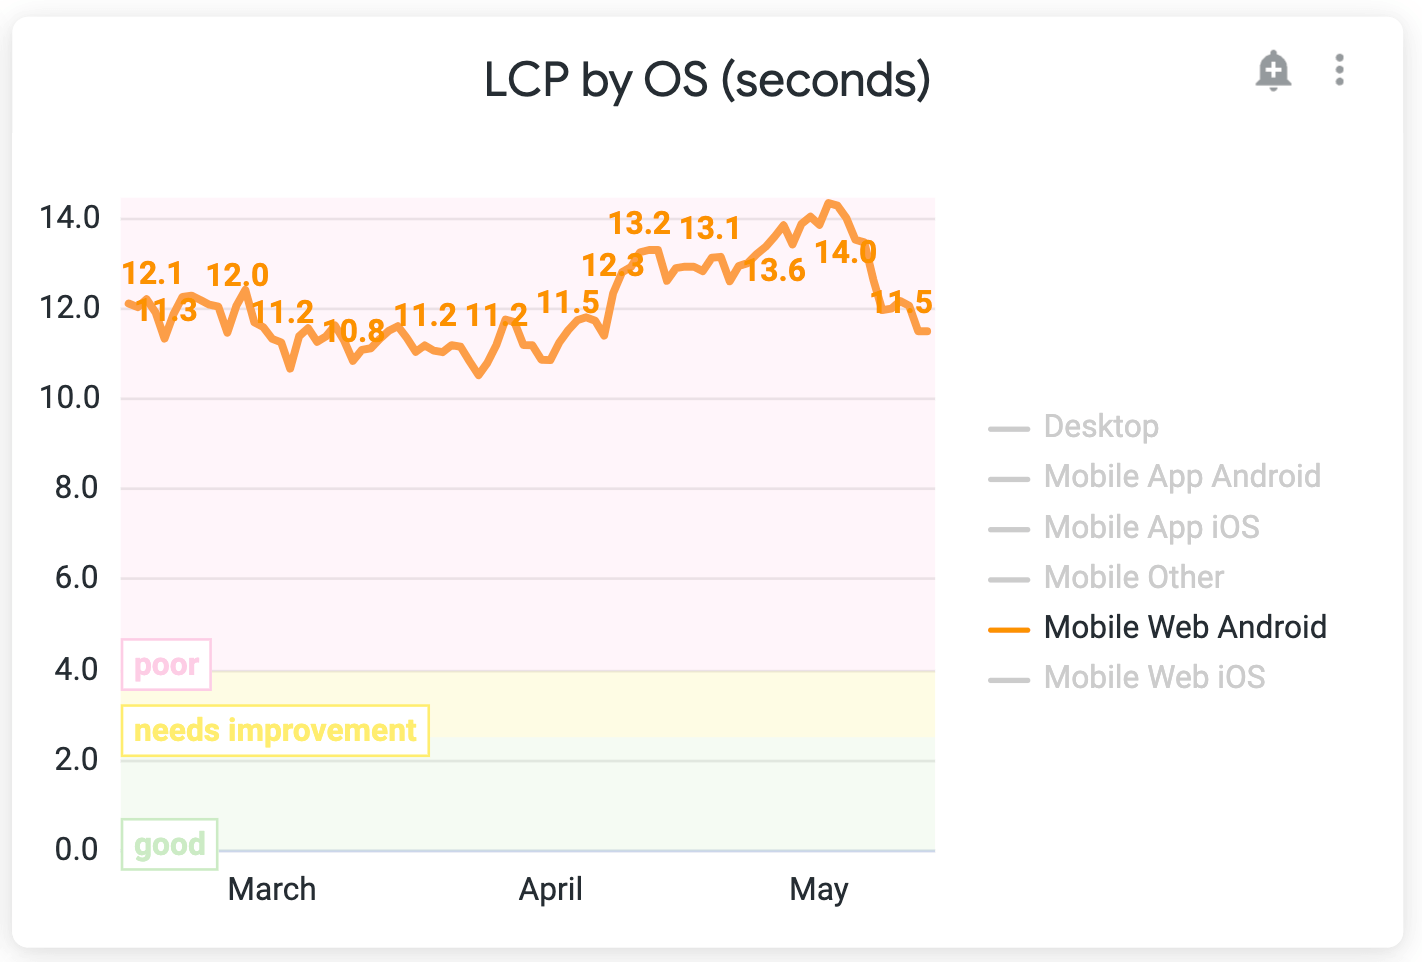
And surprisingly we also had improvements for LCP. It improved in more than 2s for Android mobile devices (web and app — app using webview).
Results
Summing up, these are the complete results of all optimizations together
- INP General: 850ms to 260ms (69% improvement)
- INP Mobile: 1.1s to 300ms (72% improvement)
- INP Desktop: 440ms to 150ms (66% improvement)
- LCP Mobile: >2s improvement (20% improvement)
- Open search box: 230ms to 120ms (47% improvement)
- Open hotel details overlay: >3s improvement (46% improvement)
The results are promising but this is just the start of the work. There are a bunch of projects and optimizations we can work on soon. After working on them and achieving better results, I can come here and write a new article with the learnings and improvements.
Performance Learnings & Recommendations
This section is part of a document I wrote for Vio.com to share the knowledge and recommendations for writing performant JavaScript/React code.
Simplify abstractions
Build smaller hooks to avoid complexity (less logic and state involved). Avoid nested hooks to avoid too much complexity and many moving parts (states).
Avoid big, complex components: too much logic and states.
Any state that changes will trigger a re-rendering. If this component has many children, all of them will be re-rendered (if they are not memoized). Any state, selector, components, and expensive effects will make X times the app’s performance worse (X = times it’s re-rendered).
Make smaller components and co-colocate states where it’s used. Avoid prop drilling, for example, having all states in the “root” (or parent) component and passing them down to children components.
Prefer processing functions only when needed, especially if they are expensive. Make sure to memoize it to not call it multiple times unnecessarily.
Prefer having a hook returning only one function rather than returning multiple functions that require different states. The problem here is that If one state related to 1 function changes, all 3 functions will be (re)created and the consumer component will be re-rendered, even if the component is using one of the functions that are not causing re-rendering
This is not just for performance but for software in general: write unit tests for hooks detailing all the behaviors (business logic). It will get easier to refactor it in the future, especially if they are complex and we need to do optimizations there keeping the behavior.
Defer non-UI related code
Track events as the last operation: Dispatch state updates, UI changes, etc first; Track events later. Use yieldToMain to postpone this non-ui related code so the browser has more time to work on UI-related operations.
Overlays
This is more specifically for our application because of the way we implement our overlay architecture. It uses the history API through react-router so every time we update the overlay, anywhere it’s used react-router will cause a re-rendering. APIs like useLocation, useRouteMatch, and useHistory could be replaced with the history or location from the window object.
Soon we pretend to move our application to Next.js so we just need to remember that the server doesn't have access to the window object. In this case, we need to wrap it with useEffect or run the component with use client.
State Management & Redux
Redux is a global state manager so if we store one value and it gets updated, all the components that hold that reference will be re-rendered. Redux notification time can be quite high so we need to be careful about how to use Redux. Colocating Redux state where the place needs it is especially important here so we don't spread states all over the place and have a nightmare dealing with performance bottlenecks.
For selectors, prefer getting specific values rather than getting entire objects. That way we can cache the values which is not possible with object reference, unless we use shallow comparison.
Don’t use useSelector for non-selectors. If we have a function, let's say a function to get a value from the browser cookie, and use it in a useSelector, Redux will always check for updates and it can be a bottleneck because of this unnecessary useSelector usage.
For most of the cases, if not all of them, memoizing selectors can improve a ton the performance of the application, especially if you have heavy selectors. That way we get the cached value without processing the function again and again, also, not causing a re-rendering for components.
Next steps
Here are the next steps going forward:
- Based on poor score INP targets, I got some features to optimize
- Optimize redux middlewares: it's causing some performance bottlenecks
- Keep exploring other performance bottlenecks
- Progress with Next.js to enable streaming SSR and server components
- Experiment with React 19 + React Forget soon
That's it for now, thanks for reading this post!
Resources
I have some resources I used along the way while doing this project. I hope it can be helpful to you too: Web Performance Research.
If you are a visual person, I created this visual roadmap to learn web performance based on the webperf research repo: Web Performance Roadmap.