Optimizing Next.js Performance: LCP, Render Delay & Hydration
 Photo by Oscar Keys
At the beginning of this year, we at QuintoAndar had a big degradation in performance, specifically LCP. Over the course of many weeks, we did a bunch of analysis, investigations, fixes, and optimizations to solve this problem. I thought it might be useful to share the most interesting insights I gained during this process.
Table of Contents
- Alert & Investigation
- First Analysis & Fixes: rendering scripts
- Second Analysis & Fixes: LCP image, CDN, cache
- SRR & Hydration
Alert & Investigation
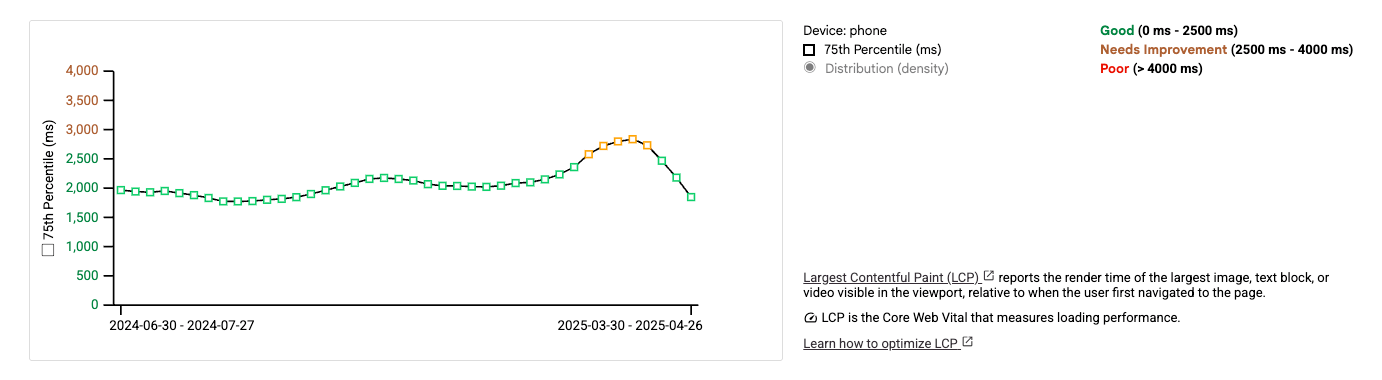
On February 12th, we had a significant issue related to LCP (Largest Contentful Paint), a performance metric that measures how long it takes for the main content of a page to load. It moved from ~2.2s and increased progressively until it reached ~2.9s and stabilized.
We have alarms that alert us when something is causing degradation for web vitals metrics. On Feb 12th, we got this alert and started investigating what was causing the problem.
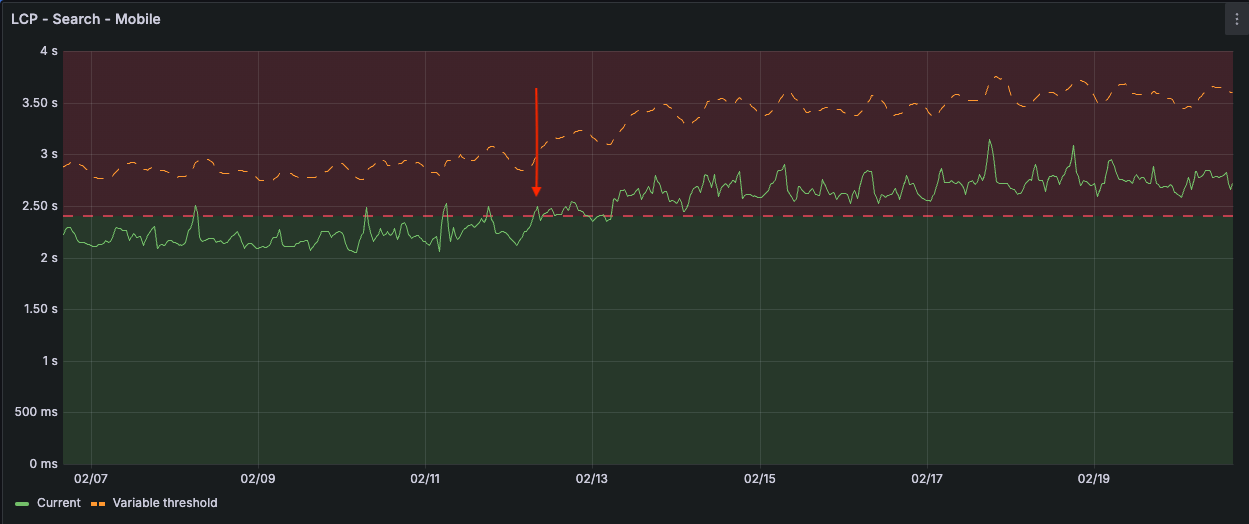
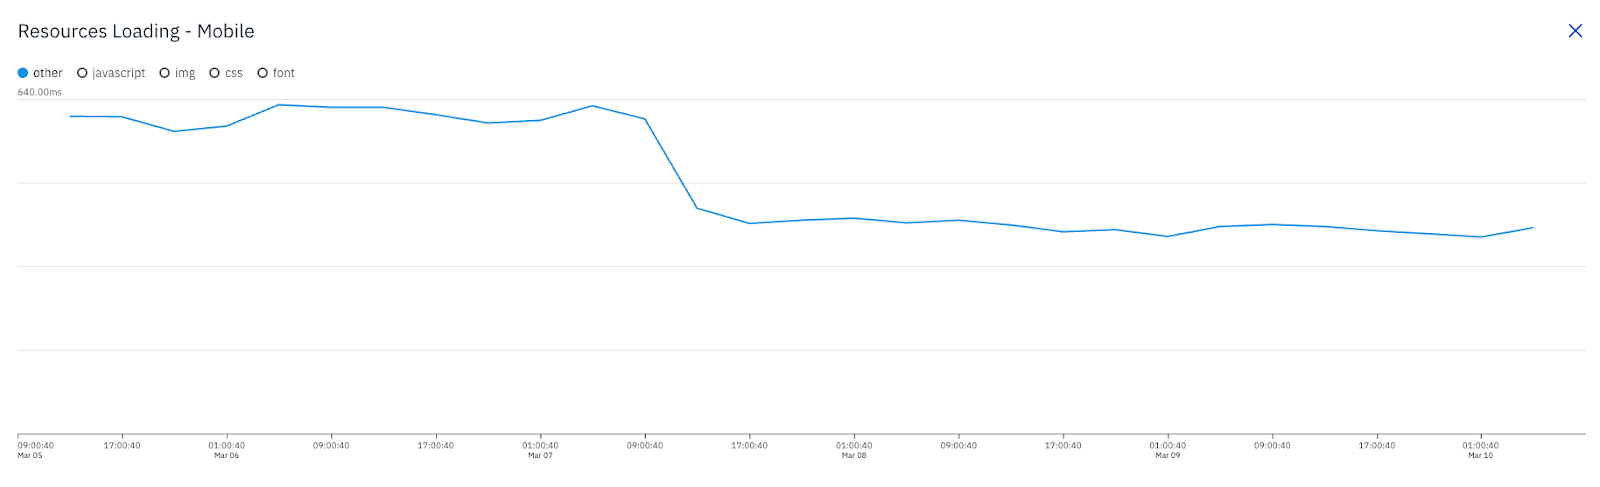
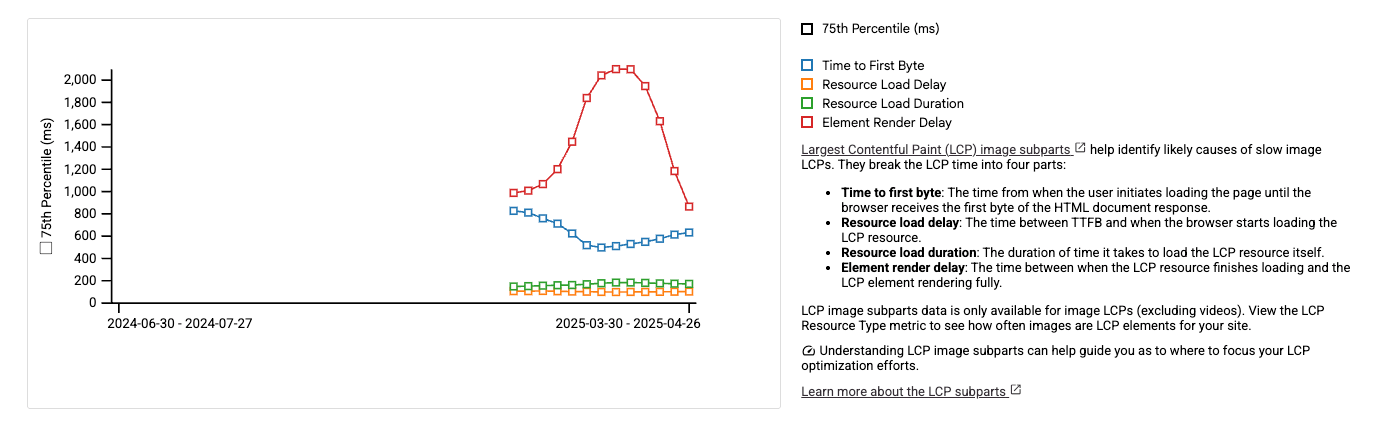
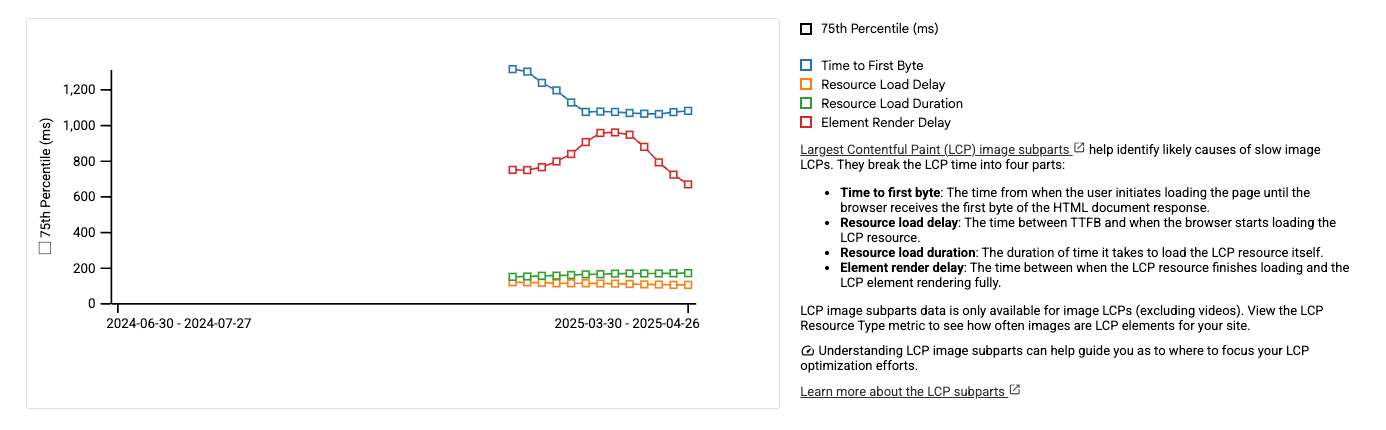
The problem seemed to be related to the “Element Render Delay” phase of the LCP metric, both for desktop and mobile:
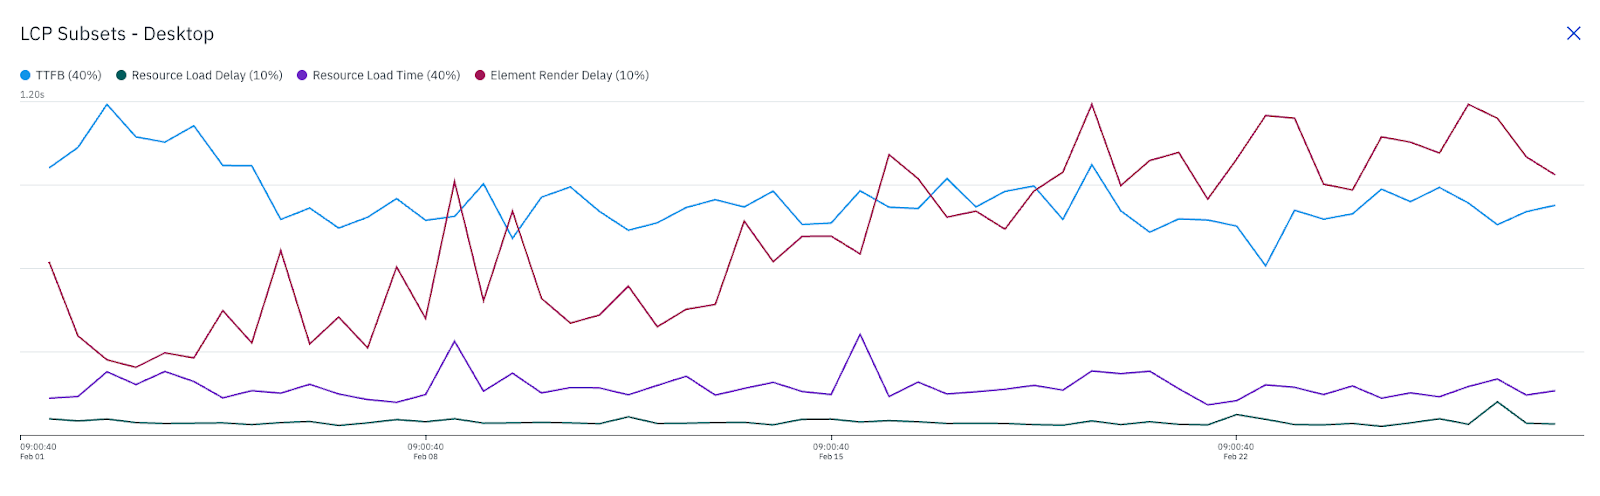
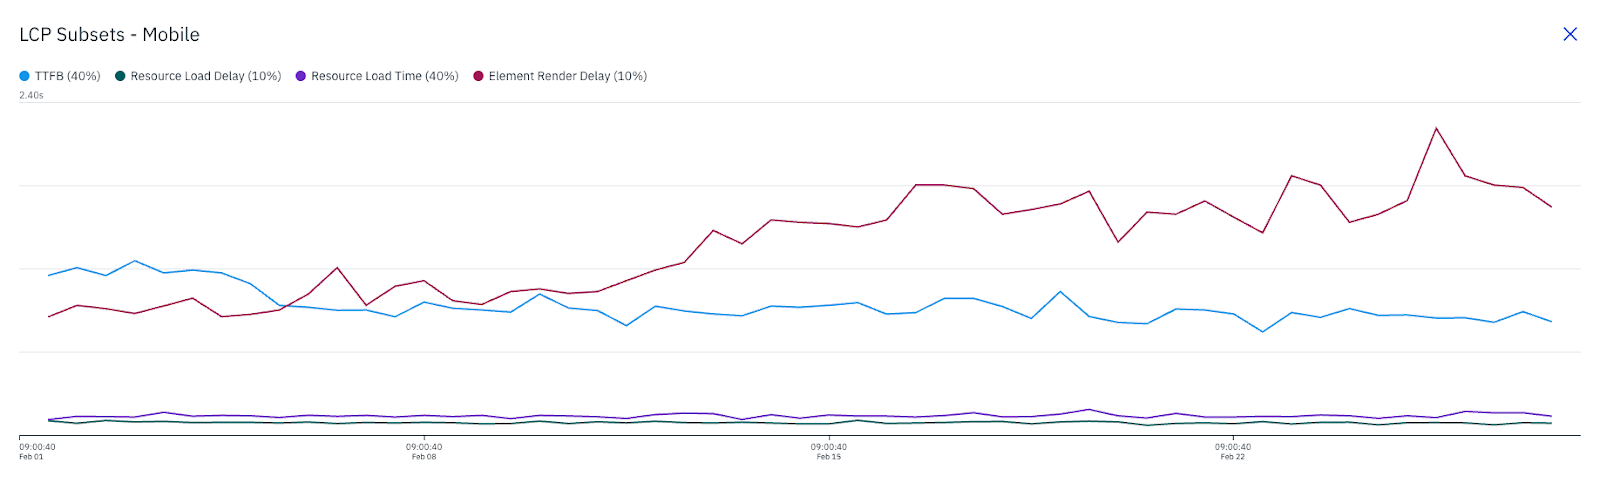
The other phases were stable at the time.
To complement this first investigation, we also saw this increase of LCP again on February 26th:
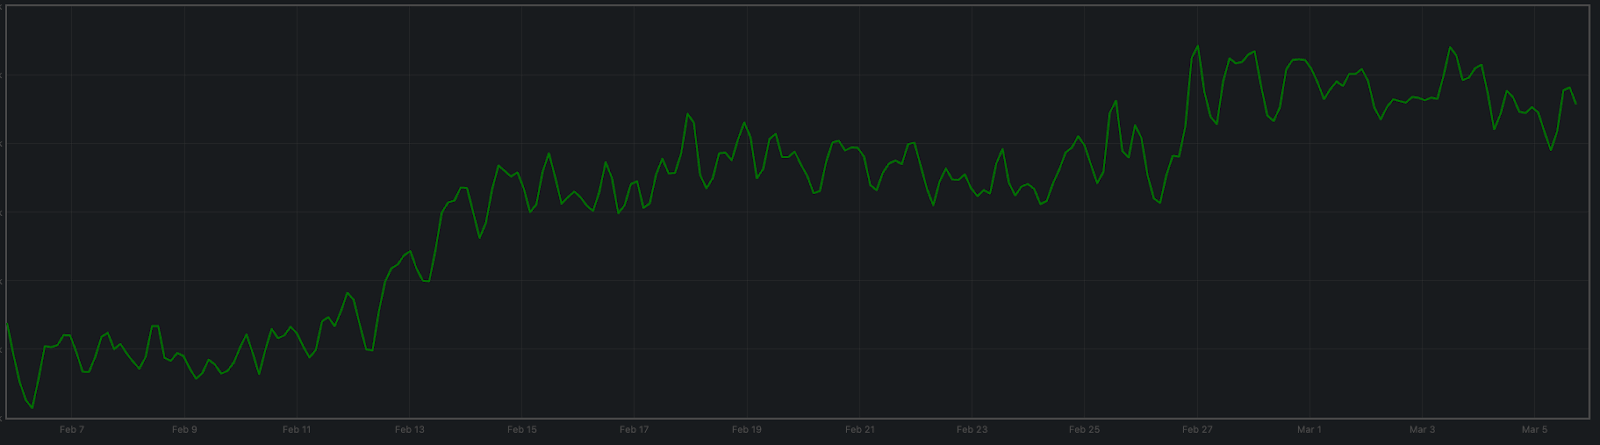
It was smaller than the first one, but it made our work even more challenging than it was before.
First Analysis & Fixes: rendering scripts
Using dev tools to debug the LCP performance problem, we noticed possible improvements and fixes for this first analysis.
Here is the full picture of what is happening before reporting the LCP element:
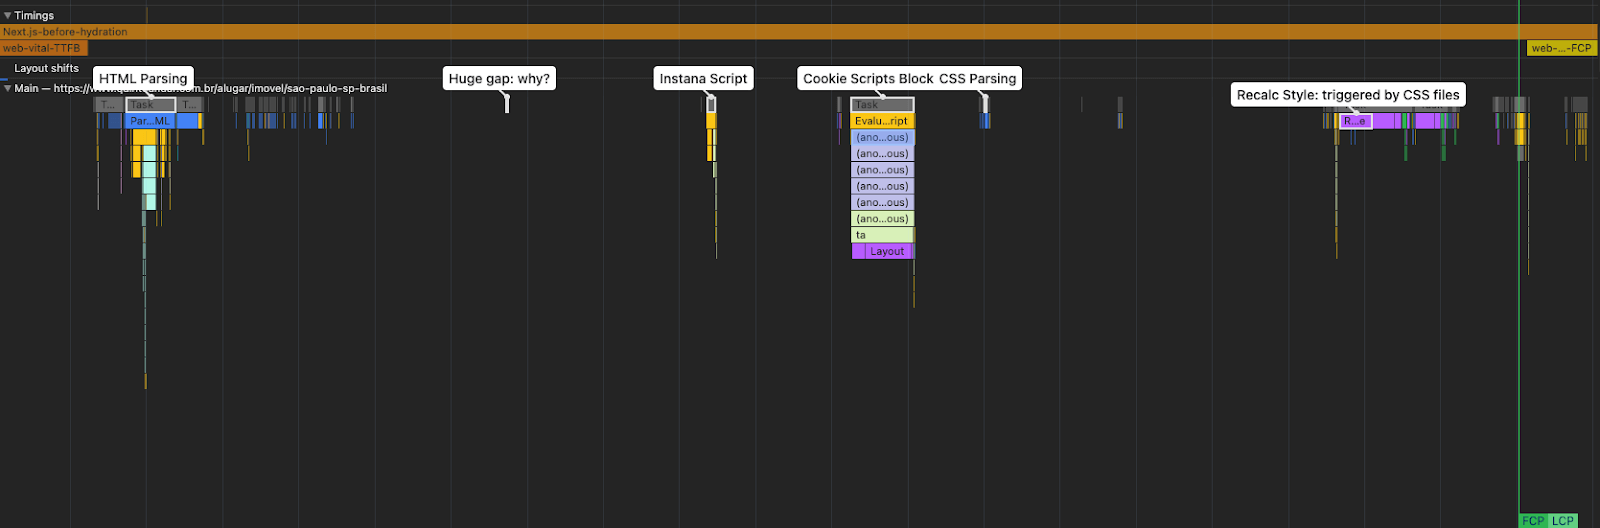
Operations and scripts running before the LCP image is rendered and reported:
- Parsing HTML
- Gap: fetching scripts (CSS, JavaScript, resources in the
<head>) - Instana (tracking/observability)
- Cookie Banner
- CSS Parsing & Execution (recalc style)
After fetching and executing all these scripts, the page is ready to be rendered, the LCP image will show up and be reported. They could be blocking the page rendering, causing a huge element render delay (trace).
With that in mind, we started to find opportunities to optimize CSS code and render-blocking JS scripts, with the intention of improving render delay and LCP.
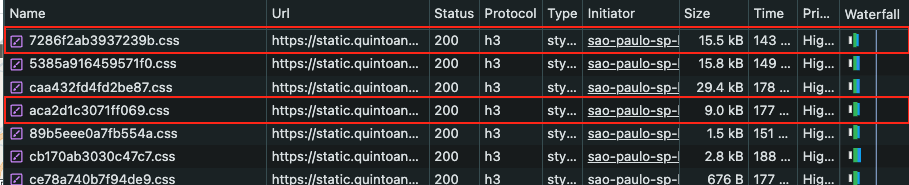
The first opportunity came from removing unused CSS files from the old design system tokens. Together, they were around 24.5kb of CSS and possibly contributed to blocking the page and worsening the element render delay.
The second opportunity was related to CSS animations. We use Material UI (MUI) and saw some animation frames while debugging LCP issues with devtools.
Every time we recorded performance traces, we saw these MUI animations for inputs:
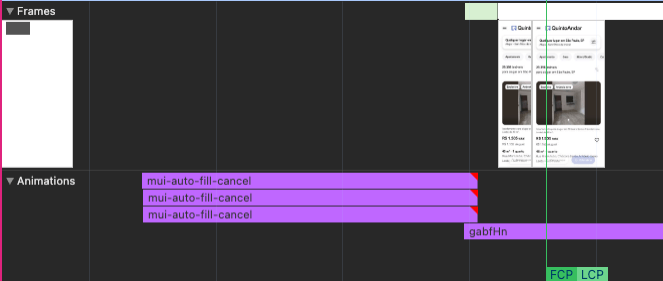
MUI injects it, and they recommend disabling it to get some performance improvements (here) by passing the disableInjectingGlobalStyles prop to the input component. It runs because we keep a Drawer mounted for SEO purposes.
Still related to CSS, we noticed that some CSS files were blocking the page rendering:
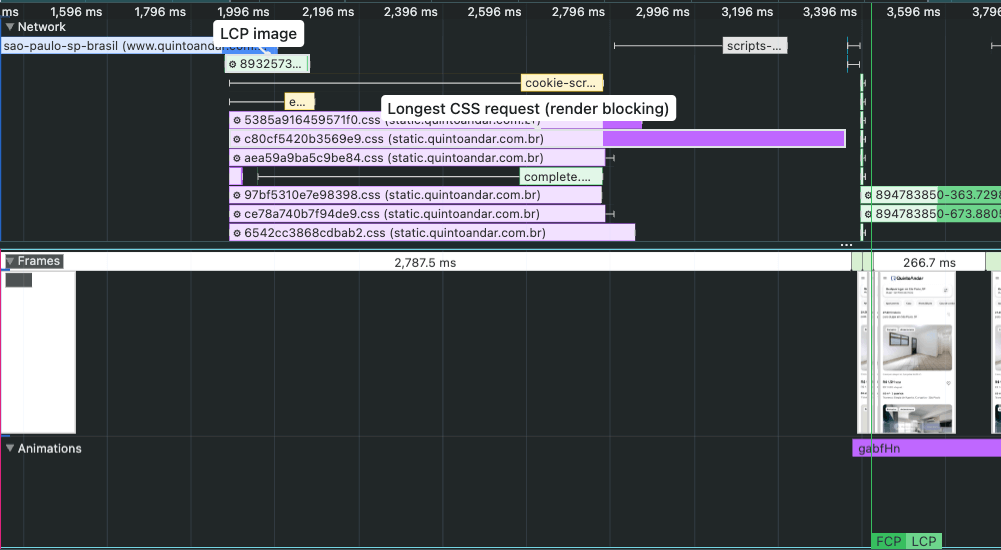
We can see the LCP image request has completed long before any content has rendered on the page. The reason why the LCP image doesn't appear immediately after the request finishes is due to two CSS stylesheets that are blocking the page from rendering (trace).
One idea was to inline the CSS styles, but it would take a while to make it work with our current Next.js architecture. Also, we didn't touch anything CSS related in our infrastructure and architecture, so we started to investigate other low-hanging fruits.
Regarding JavaScript scripts, we optimized two scripts: the cookie banner and the instant (observability) scripts.
For the cookie banner script, we just added an async property to fetch the file asynchronously. With that, the fetching doesn't block the main thread. The main thread is only blocked when the script is running.
<Script
  enabled
  src={process.env.NEXT_PUBLIC_COOKIE_SCRIPTS_BLOCKER_URL}
  fetchpriority="high"
  async
/>
The Instana script was causing a recalculate style + layout when it got executed. The idea was to use the defer property and move it later in the page rendering.
<Script enabled={instanaEnabled} defer>
  {getInstanaScript(cookies)}
</Script>
Second Analysis & Fixes: LCP image, CDN, cache
In this second analysis, we started to investigate if we had any problems related to the request and download of the LCP image.
In our CloudFront dashboard, there was no degradation in cache ratio or origin latency:
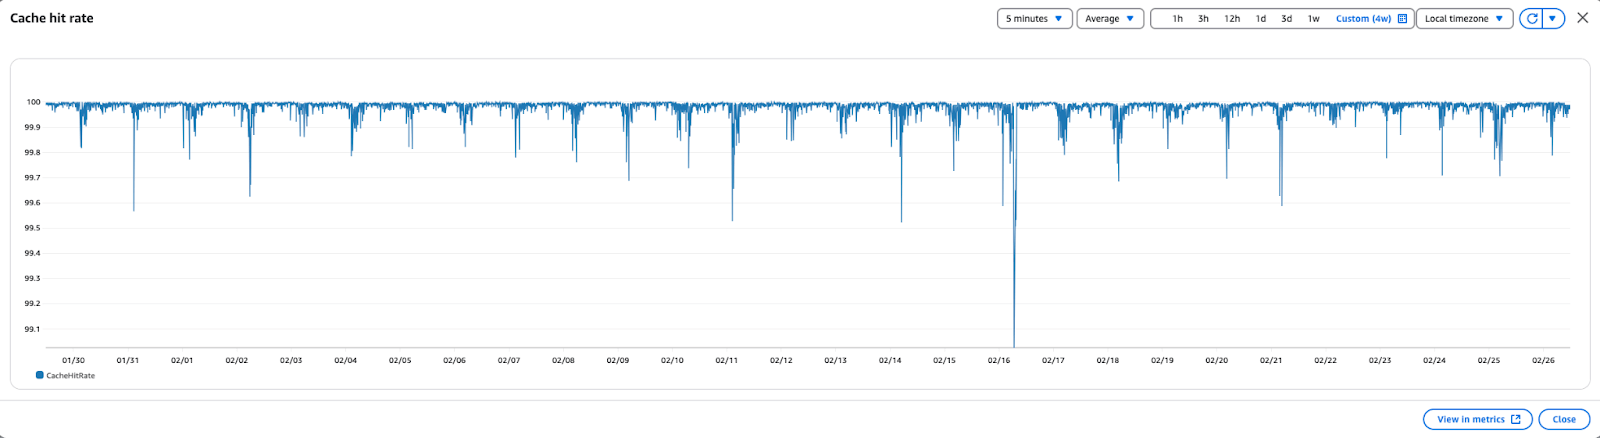
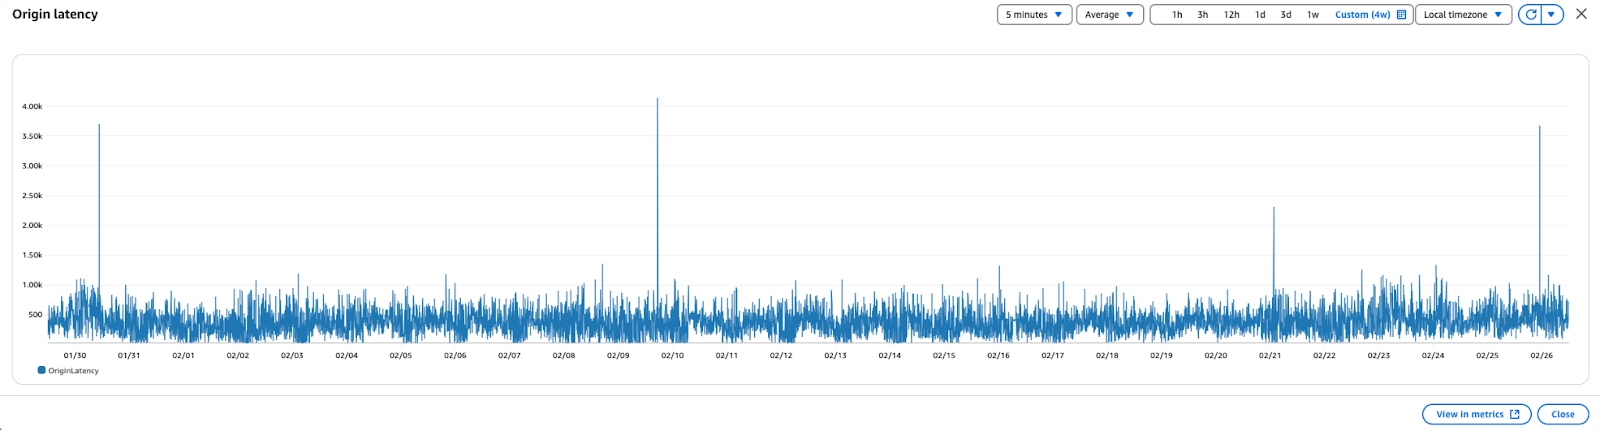
Grafana didn't show any problem with the cache ratio for CSS files, too:
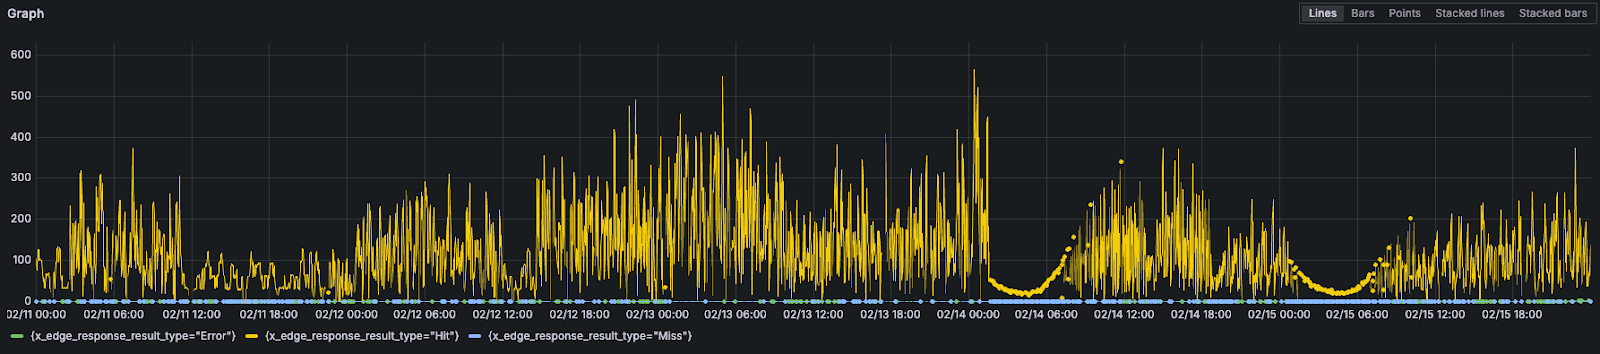
In terms of infrastructure and caching, it looked reliable and stable.
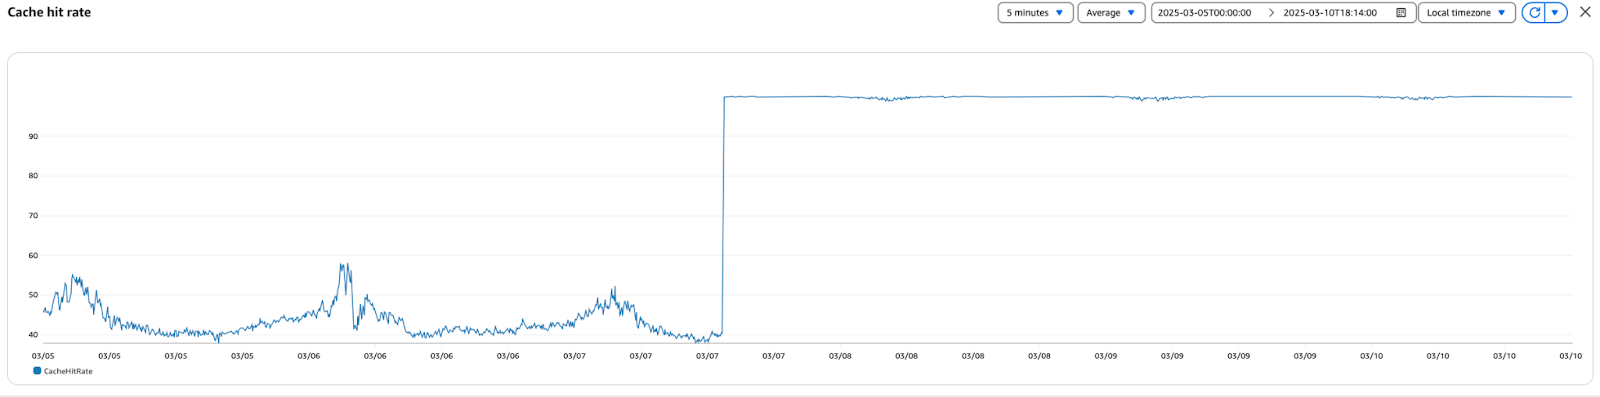
One thing we noticed, though, was related to the CDN libs we store on S3. This is the place we use for libraries like the cookie banner and scripts. But it didn't have a cache policy, so the cache hit rate was very low, and the latency was a bit high.
We added the cache policy to CloudFront with Terraform, and it fixed this problem.
It fixed the cache ratio:
And it dropped the latency:
The last part of this second analysis was related to the LCP image.
Fetch priority is used for the fetch. In this case, the fetch is initiated by the <link>. It didn't have the fetchpriority, so the image is fetched at low priority. Usually, that means do not fetch it yet, as there might be higher priority things.
We just added the fetchpriority=high property to the image ‘link’ so the image could be prioritized.
And again, similar to the first analysis, this second round of fixes didn't move the LCP metric. Element render delay was still high.
SRR & Hydration
Investigating the LCP problem using devtools, we noticed the problem usually happened when the LCP image was triggered after the hydration process, so it brought two questions:
- Why is it triggering only after hydration?
- Is it reporting the LCP element when the page renders and again after hydration?
Using Instana, our observability tool, we could explore these questions and discover some interesting insights.
- ~80% had a big gap between FCP and LCP:
- ~75% had LCP being reported after the hydration process
- The last file from the initial CSS is finishing in 1s-1.3s and probably not causing a big delay for the LCP report
We also instrumented web-vitals to report all LCP entries so we could investigate if they were being reported twice (or more times) and add the image size so we could compare the element sizes when they were reported twice.
To report that, we just need to add the reportAllChanges flag like this:
onLCP(reportAllLCP, { reportAllChanges: true });
To report the image size, we can get that information from the entry’s size property:
entry.size; // in "px²"
With this instrumentation in place, we went back to the data analysis and got some insights from it:
- 15-17% had two reported LCPs for the same session
- For 85-83%, it's reported one entry after hydration, which confirms that it's not an element size problem but an element finding problem (the image is already there, but the browser is finding the LCP only later on: trace)
- 67.7% of reported LCPs had the same element: this supports the idea of LCP being reported again after hydration
- The average LCP timing for the first image is 1.7s
- The average LCP timing for the last image is 4.3s
Most of the cases had fractional gap sizes between the first and second LCPs reported. We also found that this problem is a reported issue in related Chromium discussions:
- Investigate Element timings for Images with fractional pixel dimensions
- LCP is incorrect for images with non-integer dimensions
- The same DOM element can be reported as an LCP candidate multiple times
Our first task was to stabilize the image size so it doesn't get bigger and is reported again as a new LCP element.
One quick fix was to remove wrapper divs so the image could use the parent dimensions, and then the size could be fixed.
Another solution was to use the CSS max-width style for the image. We fixed it based on different devices' widths:
 {
  /* iPhone 14 Pro Max */
  @media screen and (max-width: 430px) {
    max-width: 398px;
  }

  /* iPhone XR */
  @media screen and (max-width: 414px) {
    max-width: 382px;
  }

  /* Samsung Galaxy S20, S20 Ultra, A51/71, Pixel 7 */
  @media screen and (max-width: 412px) {
    max-width: 380px;
  }

  /* Samsung Galaxy S21 */
  @media screen and (max-width: 411px) {
    max-width: 379px;
  }

  /* iPhone 12 Pro */
  @media screen and (max-width: 390px) {
    max-width: 358px;
  }

  /* iPhone SE, 6/7/8, 12 Mini, X, XS, 11 Pro */
  @media screen and (max-width: 375px) {
    max-width: 343px;
  }

  /* Samsung Galaxy S8+ */
  @media screen and (max-width: 360px) {
    max-width: 328px;
  }

  /* Galaxy Fold */
  @media screen and (max-width: 344px) {
    max-width: 312px;
  }
}
Both solutions had no positive effect. The LCP problem remained.
We got back to the investigation with devtools, and we could reproduce the problem in certain circumstances. We figured out that removing a certain component fixed the problem, so we could focus on this component and find out what was causing the problem.
It turns out the problem was happening in the appbar menu, an important part of the app. It was a set of hydration errors.
React hydration problems fall into different types of hydration issues. The most common ones for our application are the following:
- 418: Hydration failed because the initial UI does not match what was rendered on the server
- 421: This Suspense boundary received an update before it finished hydrating
- 423: There was an error while hydrating but React was able to recover by instead client rendering the entire root.
- 425: Text content does not match server-rendered HTML.
From this set of problems, the most impactful hydration problem is the 423 one because it re-renders the entire root, causing the problem of reporting the LCP image later after hydration.
In our context, this was the case. The error in the appbar caused the rehydration of other parts of the app, including the house card (LCP image), which caused a repaint of the whole page (root) and reported the LCP again.
Looking at the appbar code, we noticed two different problems were generating hydration errors and causing this major LCP problem.
In the appbar footer, we render an app version based on the build date. This is generated on the server side, and the problem is when a mismatch happens because this text renders the “minutes” differently between the server and the client. One example is the following:
- Server: it renders
Version: 28/04/2025, 09:27 - Client: it produces a new datetime and renders
Version: 28/04/2025, 09:28(notice the “28” rather than “27”)
A common solution is to add suppressHydrationWarning to the rendered text for these components:
<Typography level="caption" kind="lighter">
  <FormattedMessage {...messages.version} values={{ versionDate: date }}>
    {(text) => <span suppressHydrationWarning>{text}</span>}
  </FormattedMessage>
</Typography>

<BiomaFooter
  version={<span suppressHydrationWarning>{getBuildVersion()}</span>}
/>
Another part of these fixes was the replacement of window references to render part of the app. Two common references we have on our codebase are:
- When we want to render on the server only:
typeof window === 'undefined' - When we want to render on the client only:
typeof window !== 'undefined'
For this case, we replace them with a state and update it when it reaches the client, using useEffect as stated on the Next.js docs.
- For “server” cases: it starts with a
truevalue and then updates it tofalse - For “client” cases: it starts with a
falsevalue and updates it totrue
There are many references we needed to fix all but it made a big impact on our metrics.
Performance Impact
With all this exploration, fixes, and optimizations, we could finally drastically improve the performance of our application. Here is the list of the impact.
Huge reduction in hydration problems:
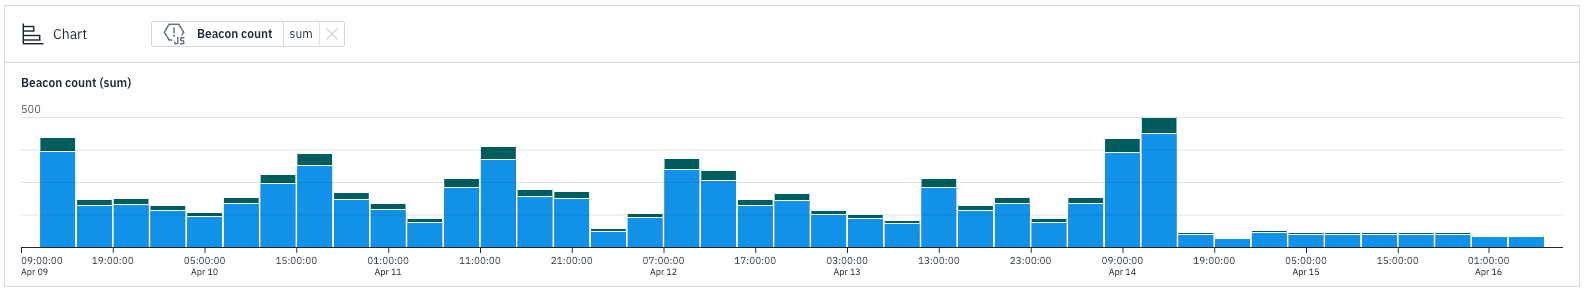
Hydration for mobile decreased:
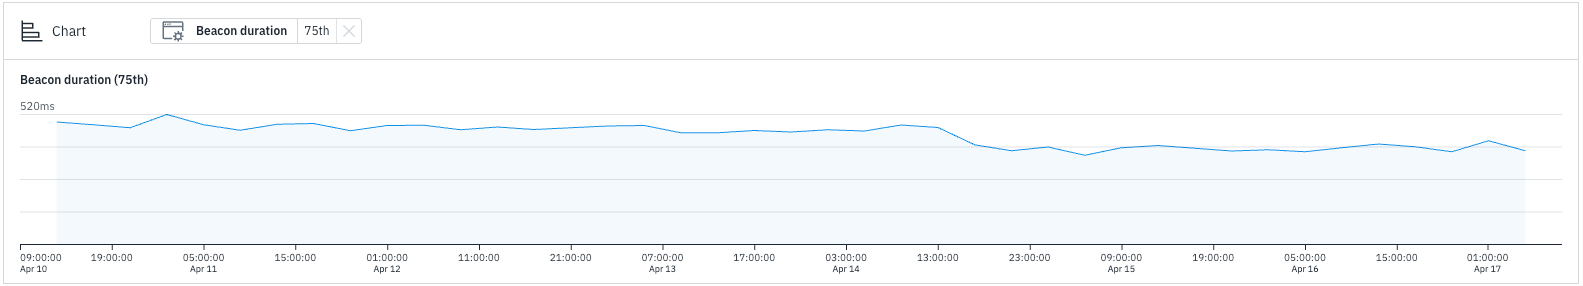
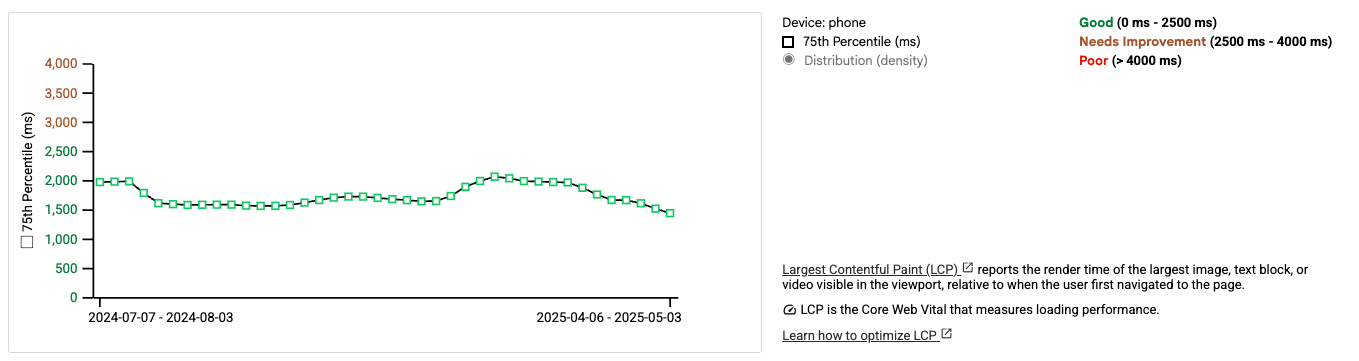
For our search page (link), the element render delay drastically improved with all the hydration fixes:
The LCP metric for search went back to the previous state and even improved a bit. We reached LCP below 2s for the search page.
For the home page, we had similar results (link). The element render delay got way better:
And LCP followed the improvement by decreasing in ~300ms:
Final words
Thanks to Thiago, Dani, Dani, Osório, and Barry for the collaboration and contribution to this major performance improvement in the QuintoAndar web app.
For additional content about web performance, follow the Web Performance Research repo.